Principal Component Analysis (PCA)
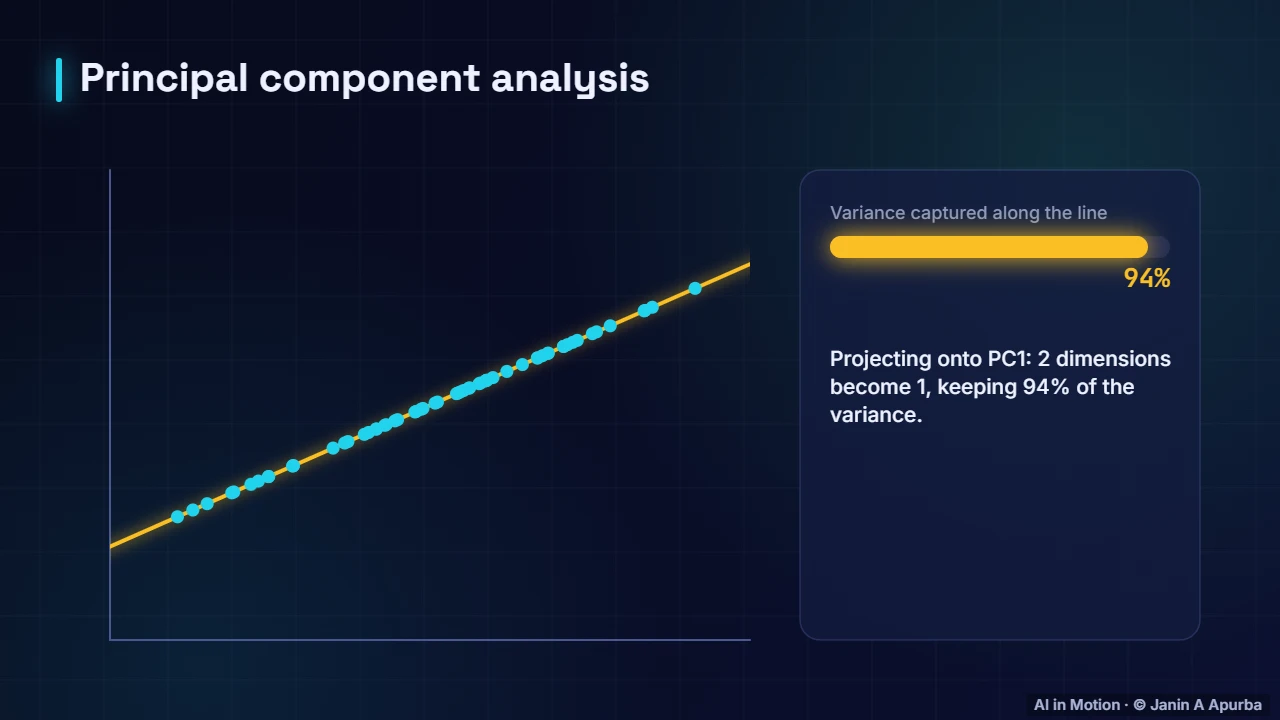
Find the direction in which data varies most, then project onto it. Watch two dimensions become one while keeping 93.5% of the variance.
📄 Illustrated notes · every chapter as a picture · printable
Quick quiz
3 questions to check your understanding.
Go deeper
University-level written lectures in The AI Lecture Hall:
Transcript
Introduction. Real datasets can have hundreds of features. Principal component analysis, or PCA, finds a smaller set of directions that capture most of the information.
Finding the first component. Here is a cloud of points that is stretched in one direction. We rotate a line and measure how much the data spreads along it. The spread, or variance, is highest along one direction. That is the first principal component. Projecting onto it turns two dimensions into one while keeping 93.5 percent of the variance.
The recipe. The recipe: centre the data, compute the covariance matrix, and find its eigenvectors. They point along the directions of greatest variance. Keep the top few and project the data onto them.
Uses. PCA is used to visualise high-dimensional data in two dimensions, compress data, remove noise and speed up other models. But the new components are mixtures of features, so they can be harder to interpret.
Recap. To recap. Principal components point where the data varies most. They come from eigenvectors of the covariance matrix. Projecting onto the top few reduces dimensions, and you should always check how much variance you keep.