Confusion Matrix, Precision, Recall and ROC — lecture notes
Accuracy alone can mislead. Build a confusion matrix, compute precision, recall and F1, then move the threshold and trace an ROC curve.
0:001. Introduction
A spam filter is 86 percent accurate. Is it good? That depends on how it is wrong. Let us open up the confusion matrix.
0:112. The confusion matrix
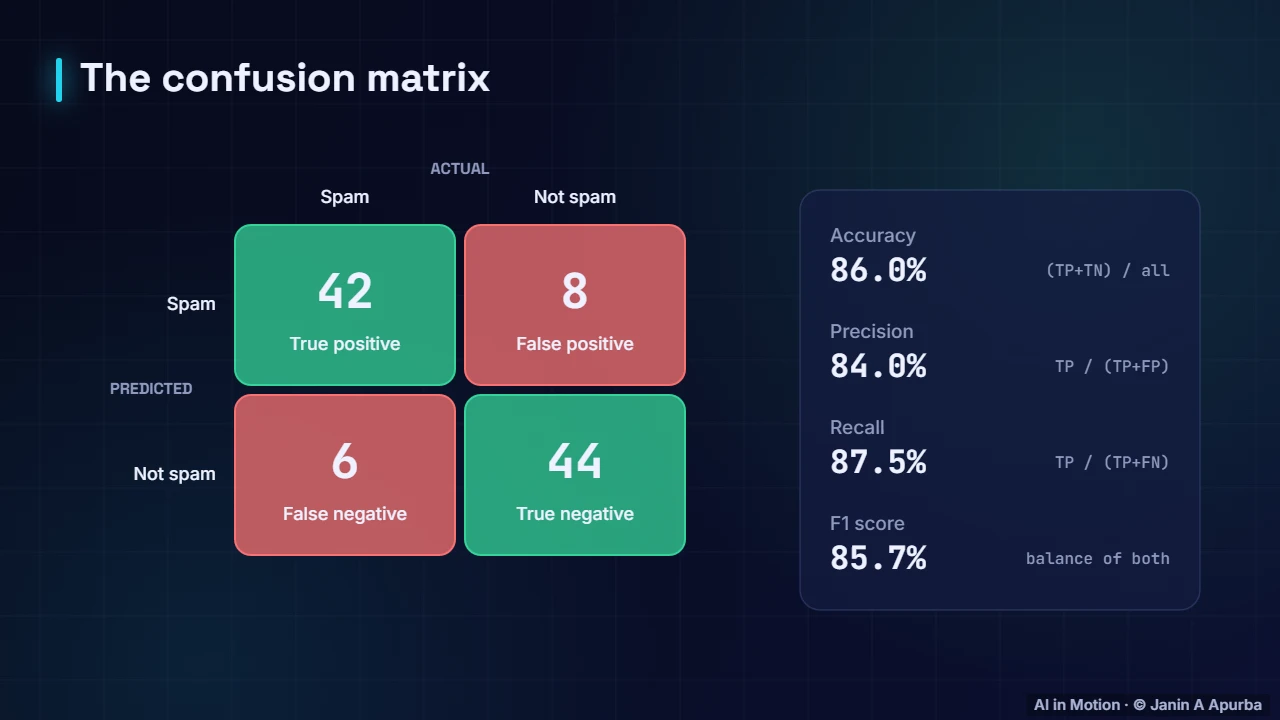
We test the filter on 100 emails. 42 spam emails are caught: true positives. 8 real emails are wrongly marked as spam: false positives. 6 spam emails slip through: false negatives. And 44 real emails are correctly left alone. From these four numbers we get accuracy 86 percent, precision 84 percent, recall 87.5 percent and F1 85.7 percent.
0:353. Precision and recall
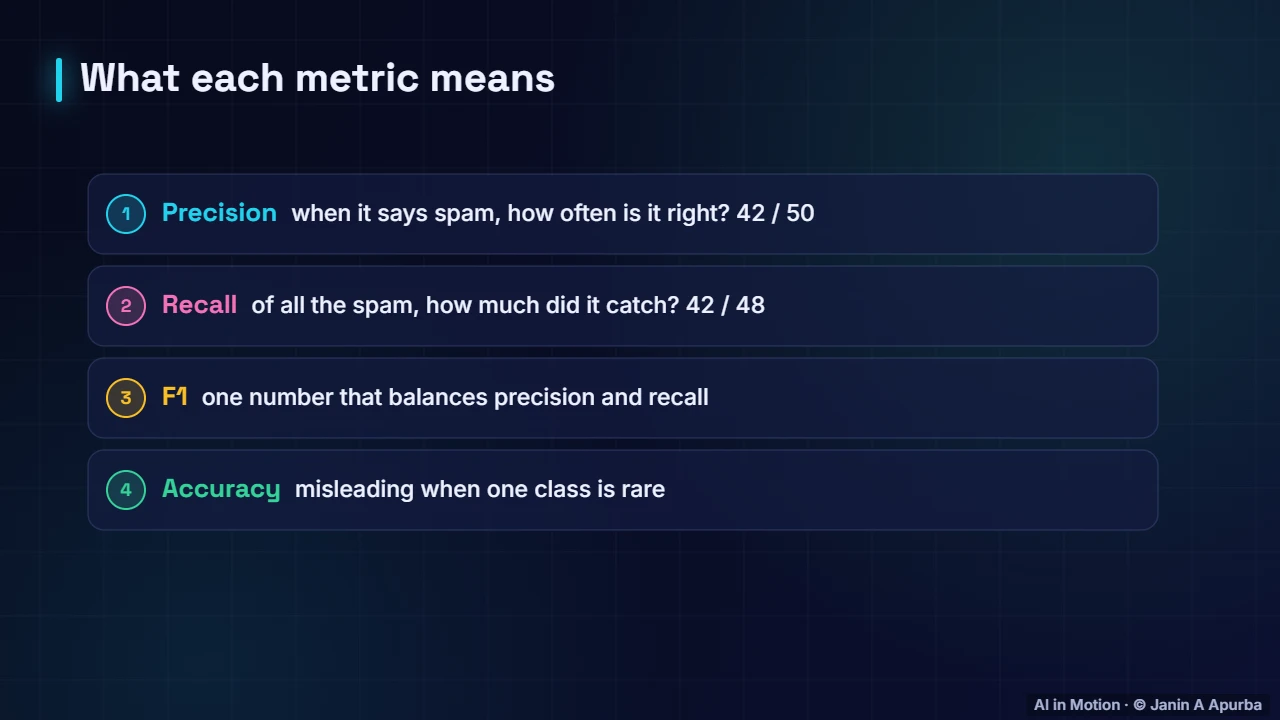
Precision asks: when the model says spam, how often is it right? Recall asks: of all the spam, how much did it catch? F1 balances the two. And accuracy can be misleading when one class is rare.
0:514. Moving the threshold
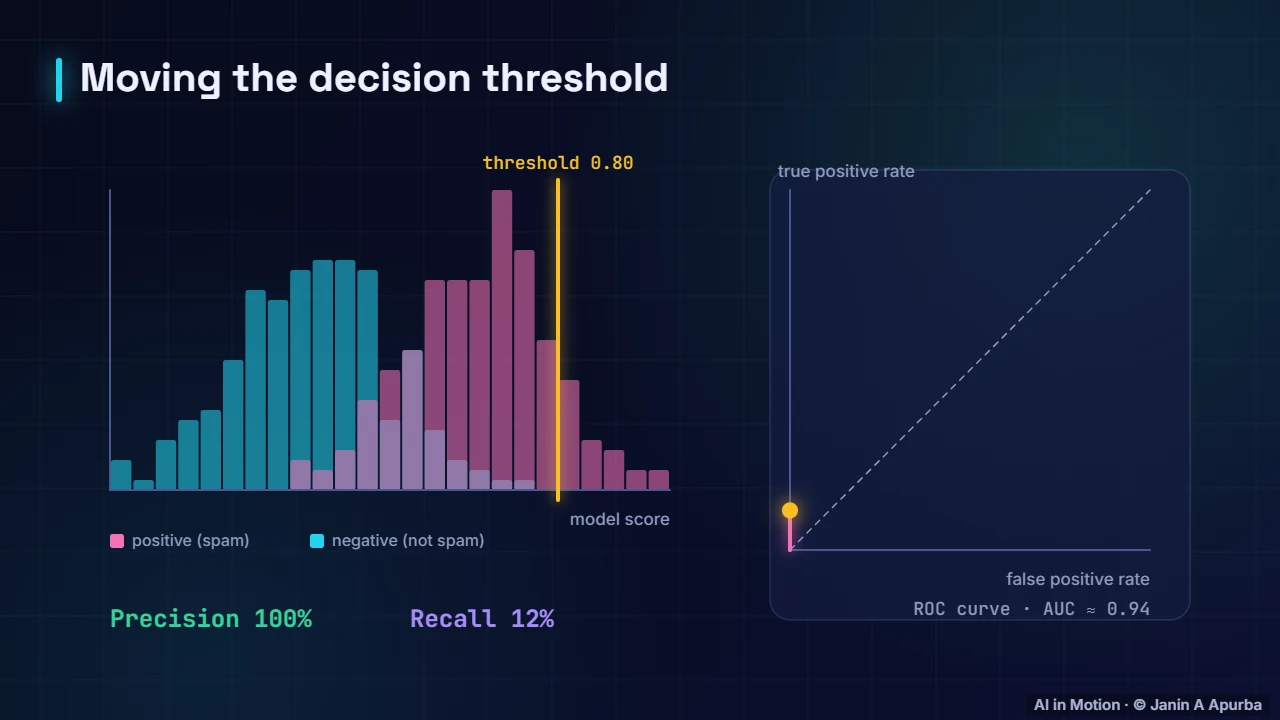
The model gives each email a score. The threshold decides which scores count as spam. Move it left and recall rises, but precision falls. Move it right and precision rises, but recall falls. Tracing every threshold draws the ROC curve. The area under it, the AUC, is about 0.94 here.
1:125. Choosing
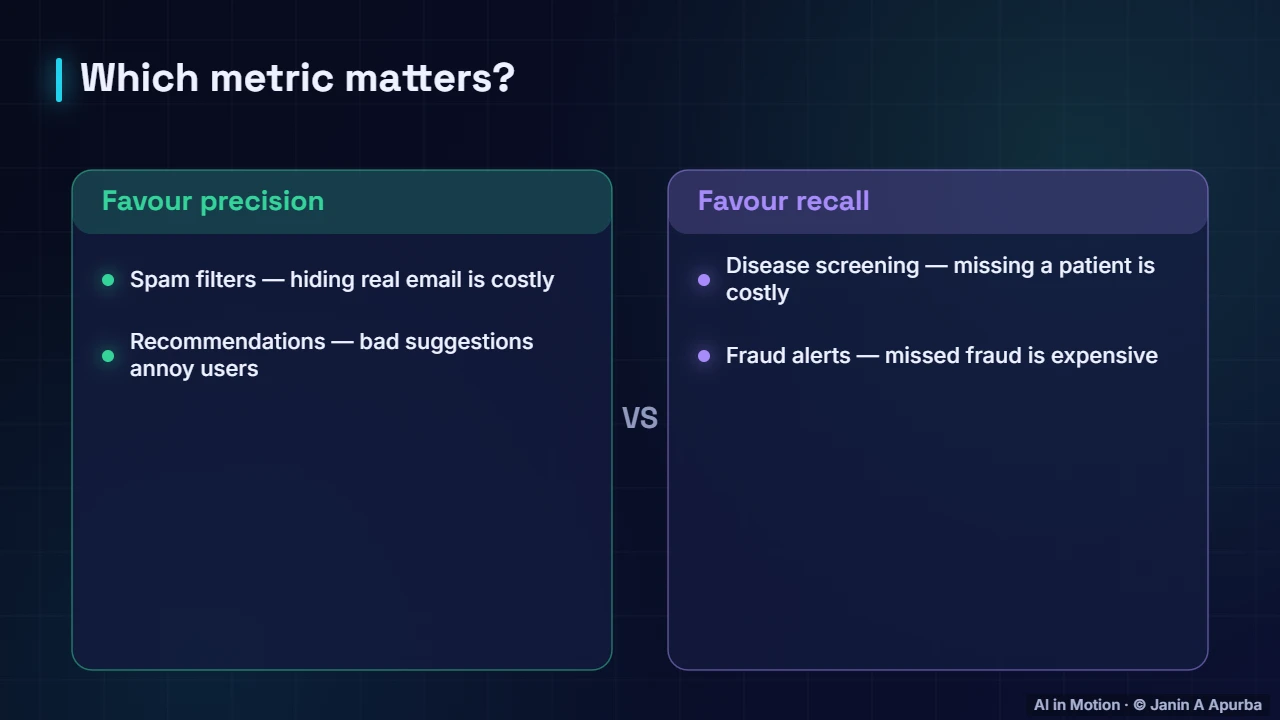
Which metric matters depends on the cost of mistakes. A spam filter should favour precision, so real email is not hidden. Disease screening should favour recall, so sick patients are not missed.
1:266. Recap
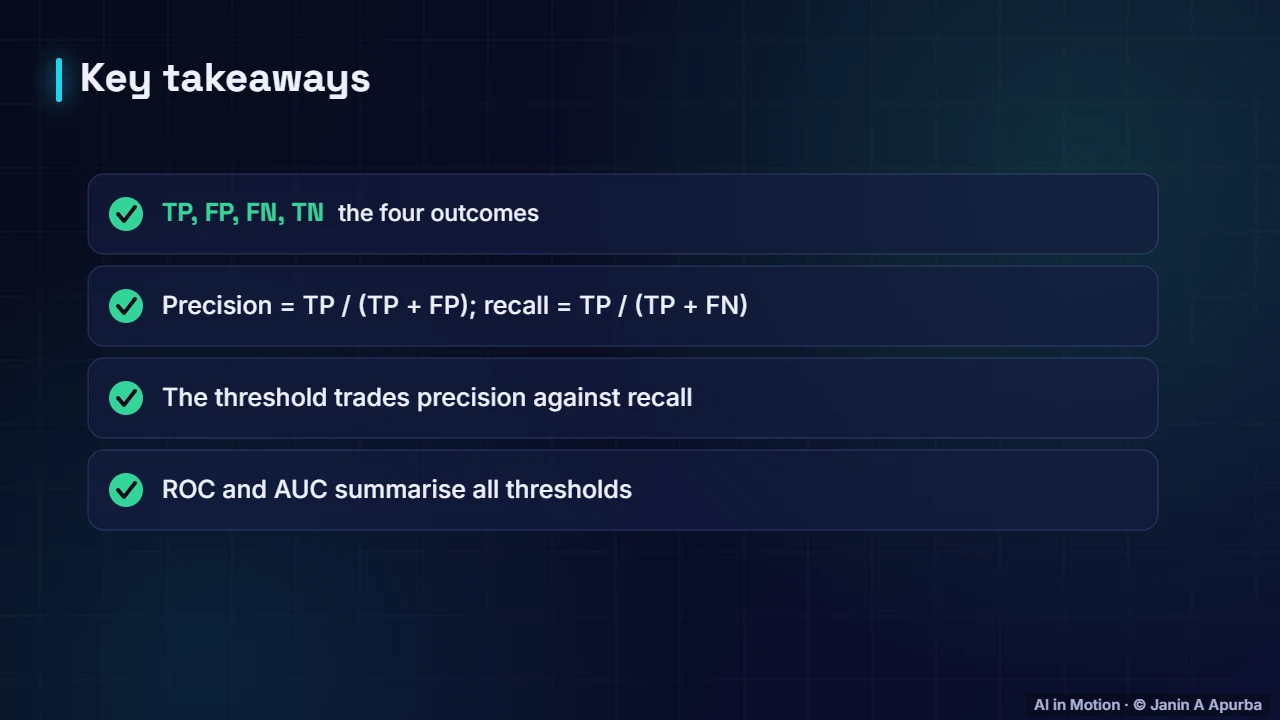
To recap. Four outcomes make the confusion matrix. Precision and recall answer different questions. The threshold trades one for the other. And the ROC curve and AUC summarise performance across all thresholds.
Key takeaways
- The confusion matrix counts true/false positives and negatives.
- In the example: accuracy 86%, precision 84%, recall 87.5%, F1 85.7%.
- Changing the threshold trades precision against recall.
- The ROC curve and AUC summarise performance across thresholds (AUC ≈ 0.94 in the demo).
Check yourself
- Precision is…
Show answer
TP / (TP + FP) — Of everything predicted positive, how much is truly positive.
- Lowering the threshold usually…
Show answer
Raises recall and lowers precision — More items are flagged, catching more positives but also more false alarms.
- For disease screening, which metric is usually most important?
Show answer
Recall — Missing sick patients (false negatives) is very costly.
Go deeper
- Evaluation Metrics for Classification: Accuracy, Precision, Recall and F1 · The AI Lecture Hall
- ROC Curves, AUC and Precision–Recall Curves · The AI Lecture Hall
- Learning from Imbalanced Data · The AI Lecture Hall
© 2026 Janin A Apurba, CSE, AUST · Advanced ICT Officer, CNRS-UNHCR. All rights reserved. Notes for the animated lecture at https://ai-in-motion.vercel.app/watch/classification-metrics.html