A/B Testing and Responsible ML in Production — lecture notes
Measure real impact and operate responsibly: online vs offline evaluation, A/B test design, significance and the peeking trap, sample sizes, model cards, fairness, privacy, explainability and governance.
0:001. Introduction
How do you know a new model actually helps people, rather than just scoring better on a test set? And how do you make sure it is fair, private and accountable once it touches real lives? This deep dive covers online experiments and the practices of responsible machine learning in production.
0:212. Offline vs online
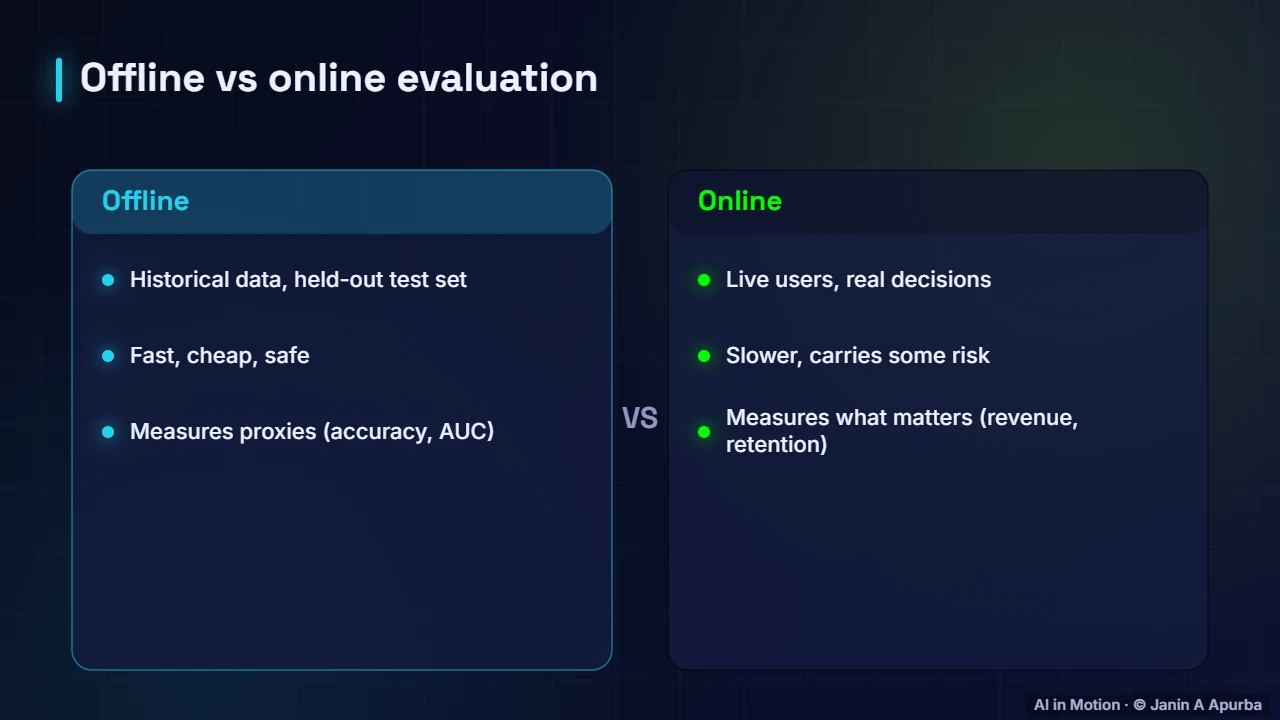
Offline evaluation uses historical data and a held out test set. It is fast, cheap and safe, but it measures proxies such as accuracy. Online evaluation uses live users and real decisions. It is slower and carries some risk, but it measures what actually matters: engagement, revenue, retention or better outcomes.
0:433. Pause and think
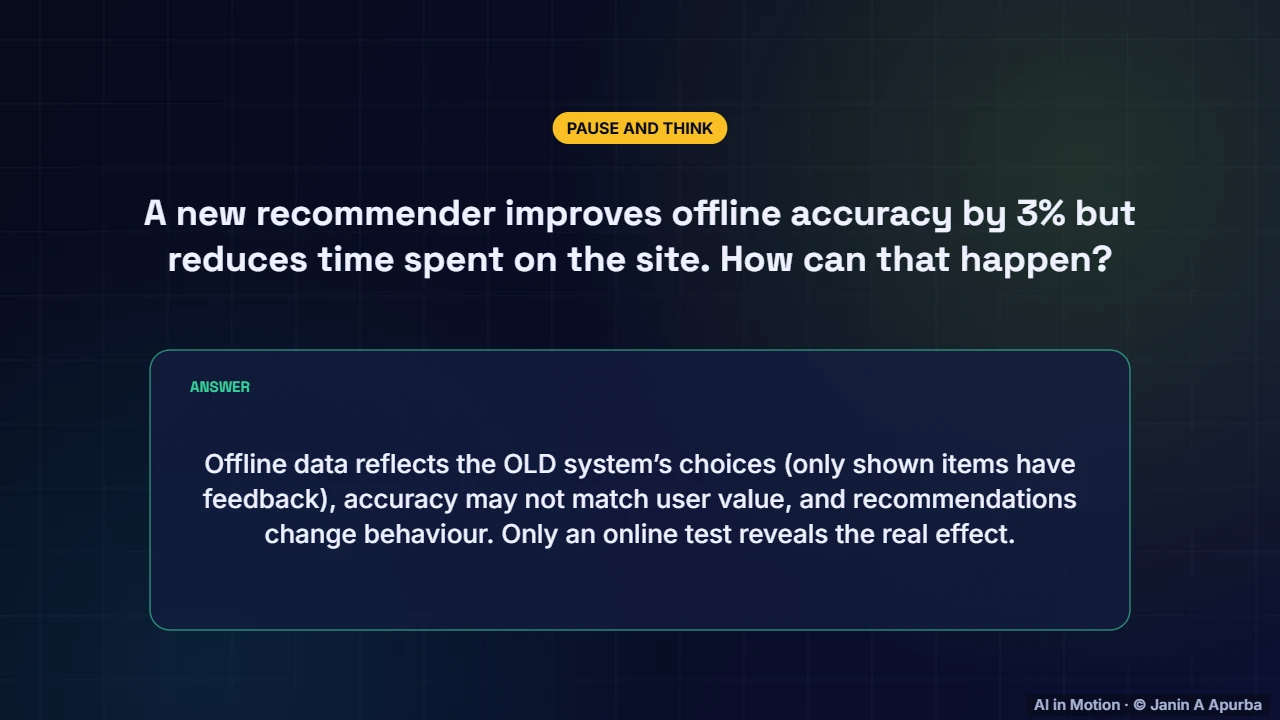
Pause and think. A new recommender improves offline accuracy by three percent, yet users spend less time on the site. How? Historical data only contains feedback on items the old system chose to show, accuracy is not the same as user value, and new recommendations change behaviour. Only an online test reveals the real effect.
1:064. A/B testing
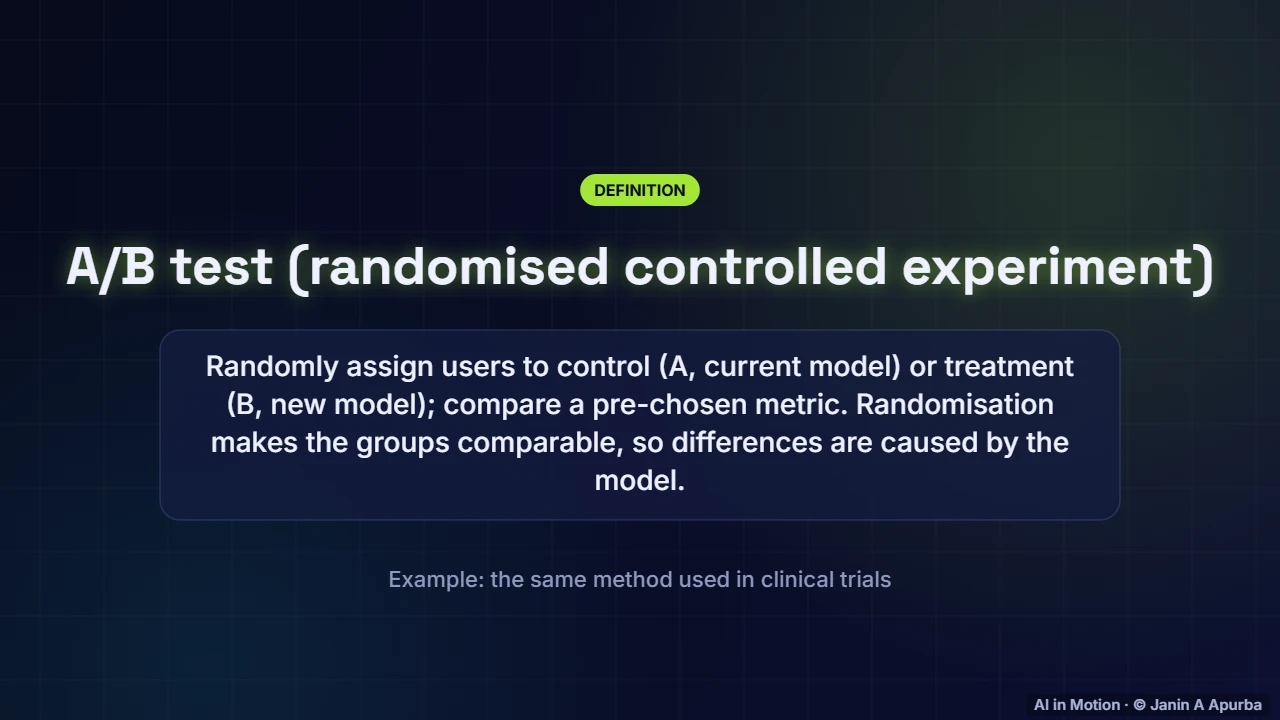
An A B test is a randomised controlled experiment. Users are randomly assigned to control, which gets the current model, or treatment, which gets the new one, and a pre chosen metric is compared. Because assignment is random, the groups are alike in every other way, so a difference can be attributed to the model.
1:295. Designing a test
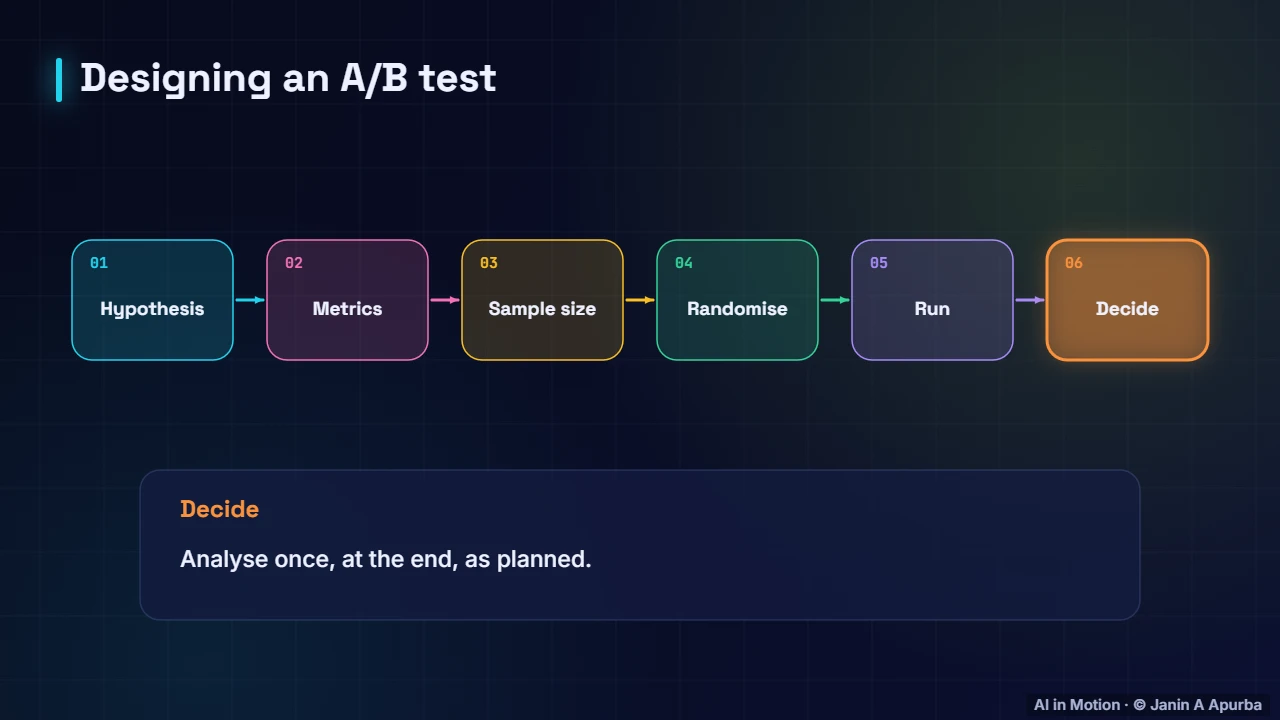
A good test is designed before it starts. State a hypothesis. Choose one primary metric plus guardrail metrics that must not get worse, such as latency or complaints. Compute the required sample size. Randomise consistently by user. Run for the planned duration, covering full weekly cycles, and analyse once, as planned.
1:516. Guardrail metrics
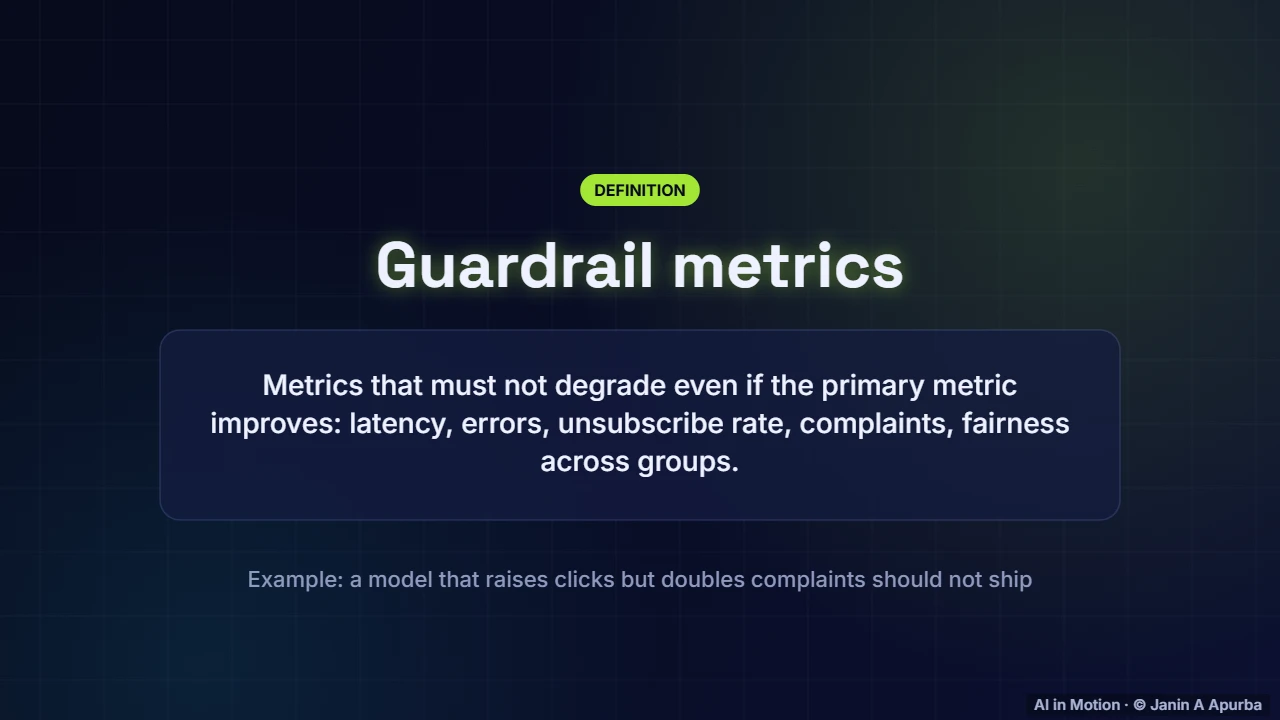
Guardrail metrics protect against winning the wrong way. A model that raises clicks but doubles complaints, slows the page or harms one group of users should not ship. Guardrails are checked alongside the primary metric, and a violation blocks the launch even when the headline number looks great.
2:117. Running the test
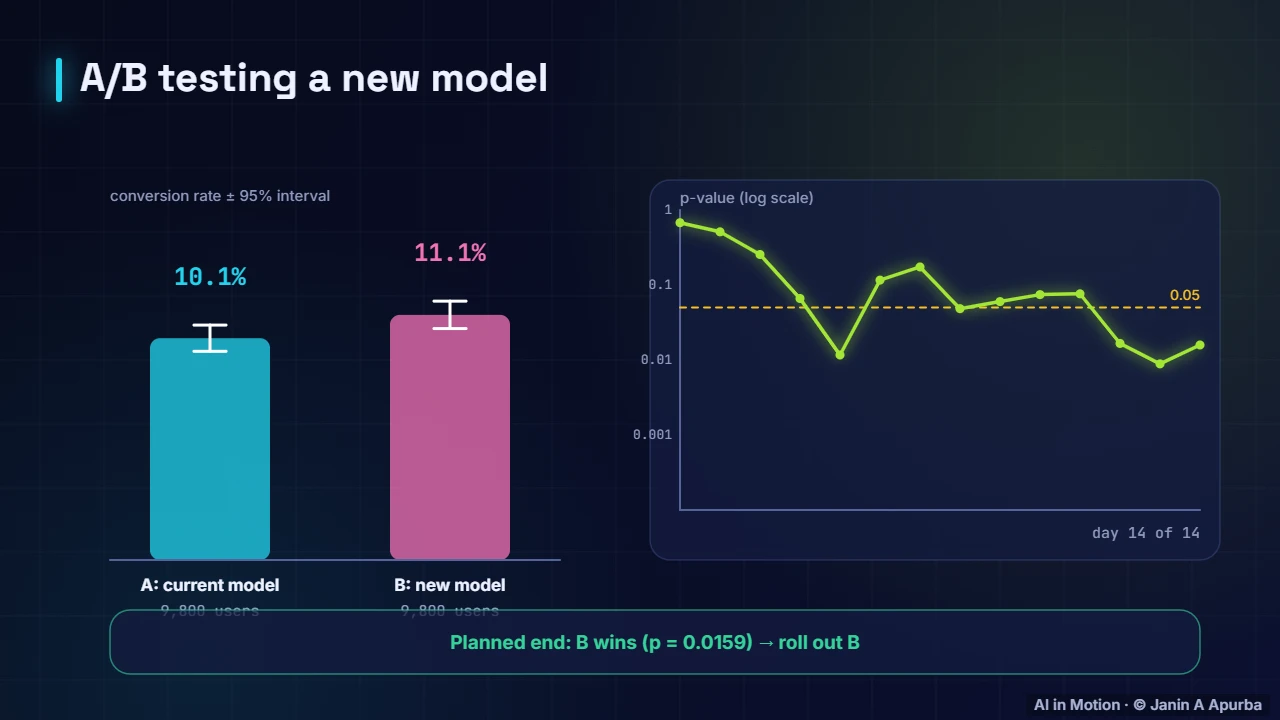
Here is a fourteen day test with seven hundred users per day in each group. The current model converts about ten percent of users, and the new model slightly more. The confidence intervals shrink as data accumulates, and the p value, on the right, wanders before settling below point zero five by the planned end.
2:348. The test statistic
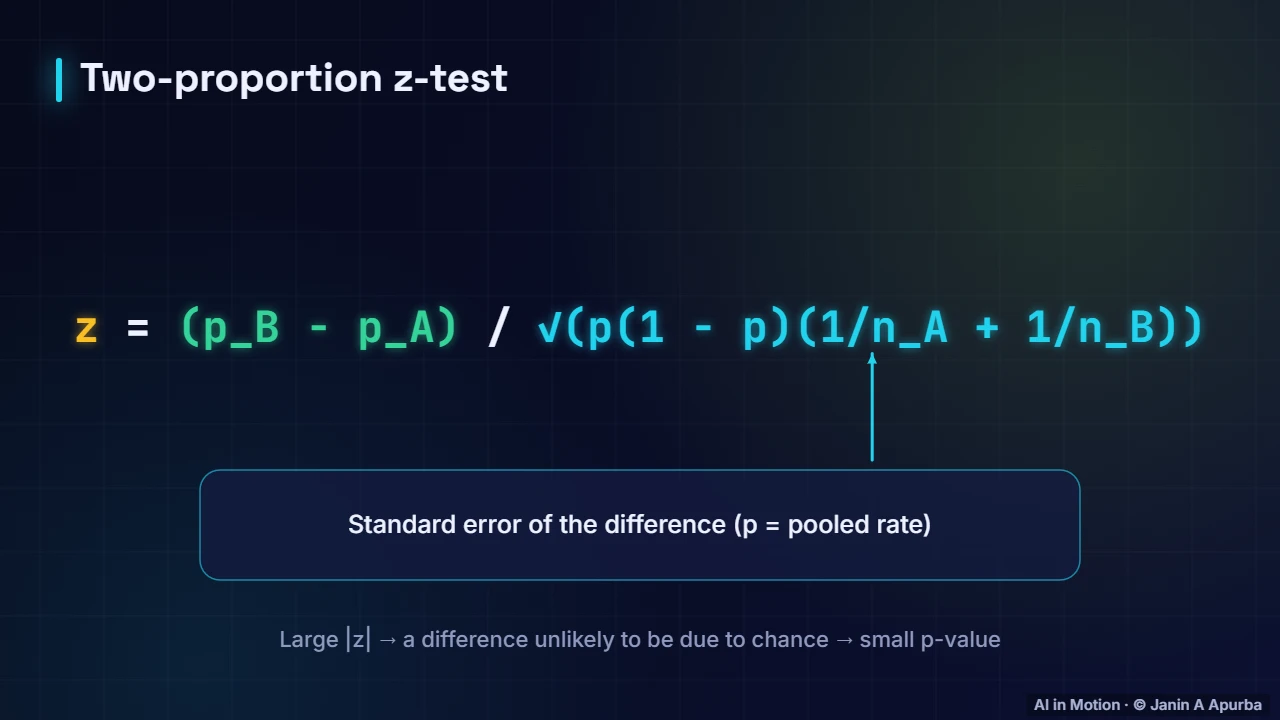
The analysis uses a two proportion z test. Divide the observed difference in conversion rates by its standard error, computed from the pooled rate and both sample sizes. A large z means the difference would be unlikely if the models were truly equal, which corresponds to a small p value.
2:559. p-values
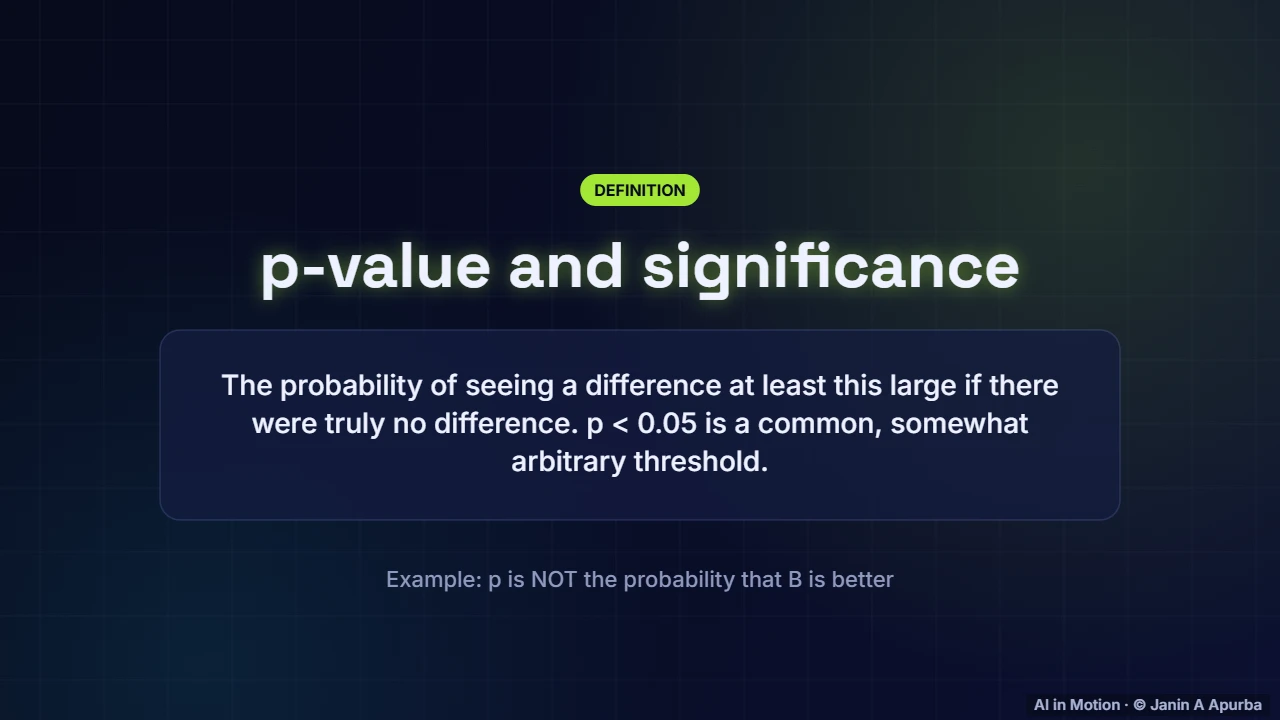
A p value is the probability of seeing a difference at least this large if the two models were truly equal. A common threshold is point zero five. It is not the probability that the new model is better, and a significant result is not necessarily a large or important one, so always report the effect size with its interval.
3:1910. The peeking trap
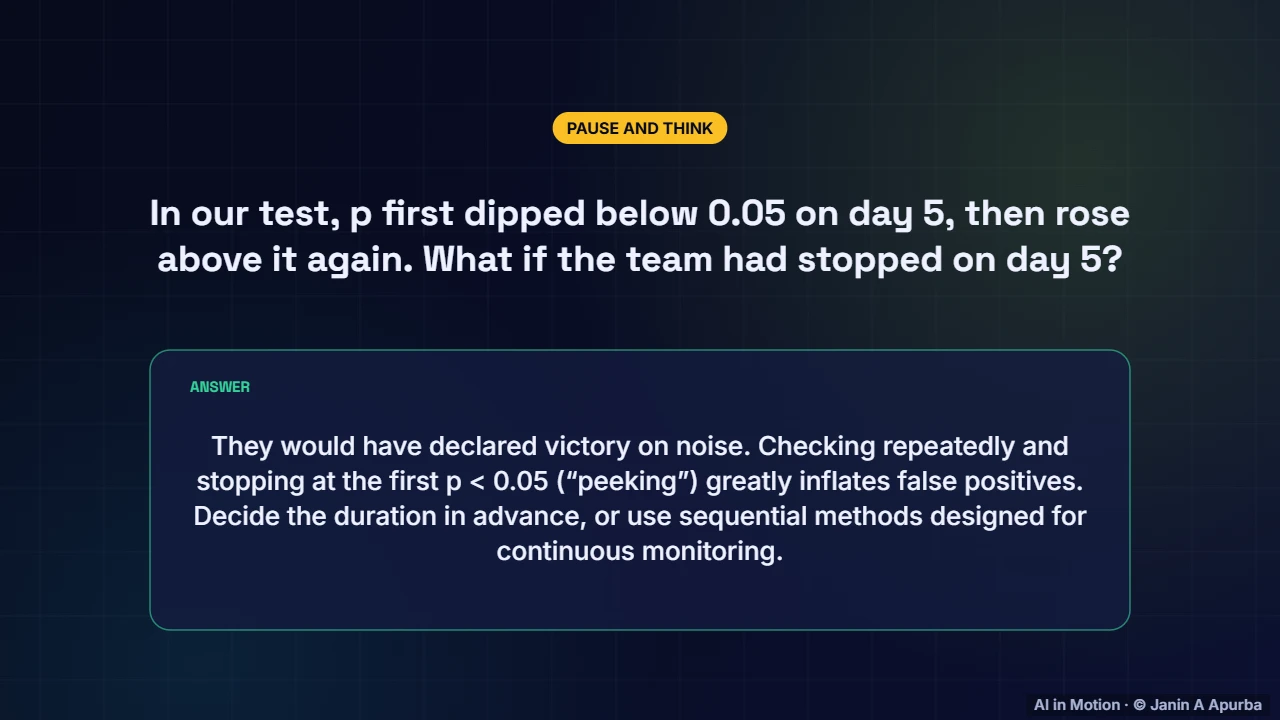
Pause and think. In our test, the p value dipped below point zero five on day five, then rose above it again. What if the team had stopped on day five? They would have declared victory on noise. Repeatedly checking and stopping at the first significant result greatly inflates false positives. Decide the duration in advance.
3:4311. Sample size
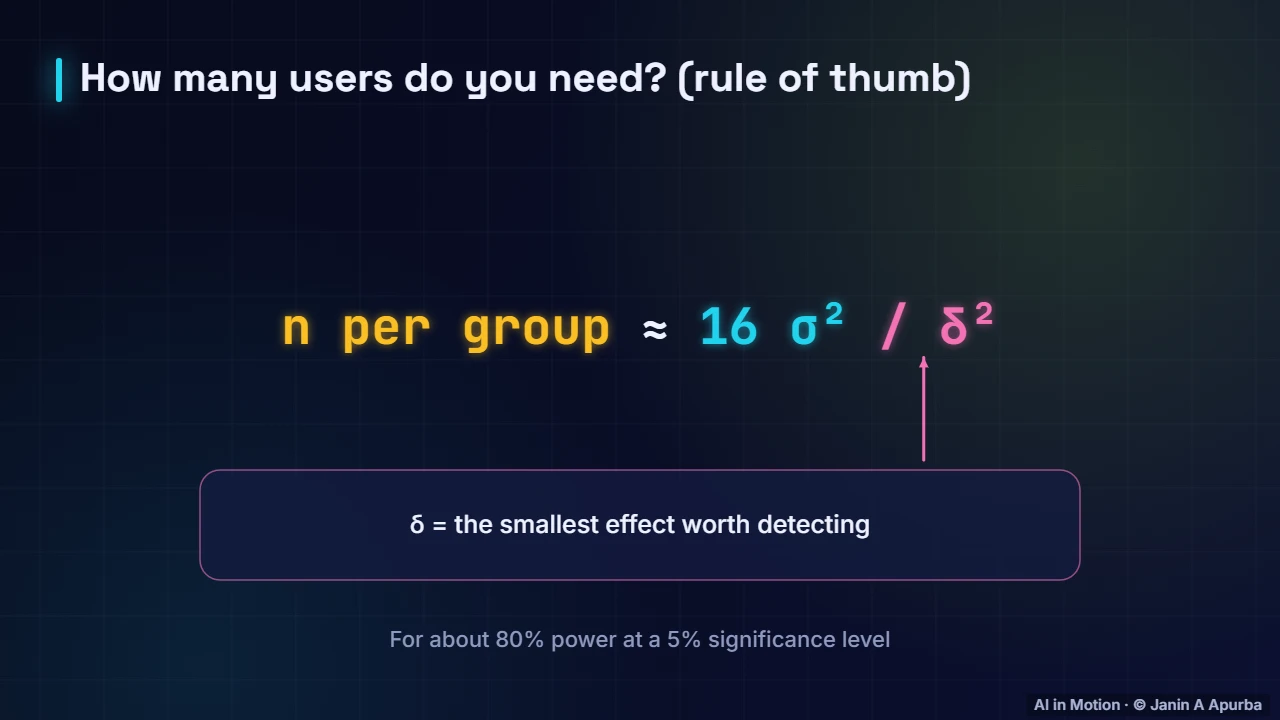
Before starting, compute the sample size. A handy rule of thumb for about eighty percent power at the five percent level is sixteen times the variance divided by the square of the smallest effect you care about. Small effects need huge samples, because the required size grows with one over the effect squared.
4:0512. Compute it
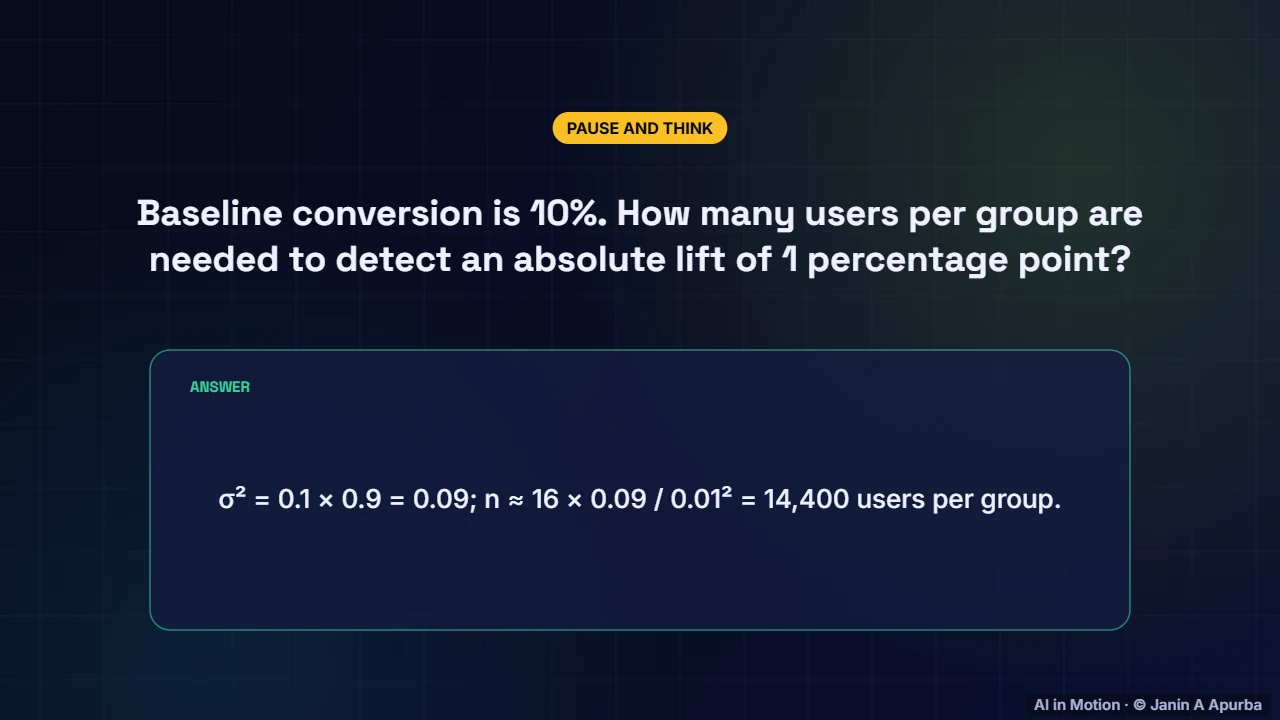
Let us compute one. Baseline conversion is ten percent, and we want to detect a lift of one percentage point. The variance is point one times point nine, which is point zero nine. Sixteen times point zero nine divided by point zero one squared gives about fourteen thousand four hundred users per group.
4:2813. Pitfalls
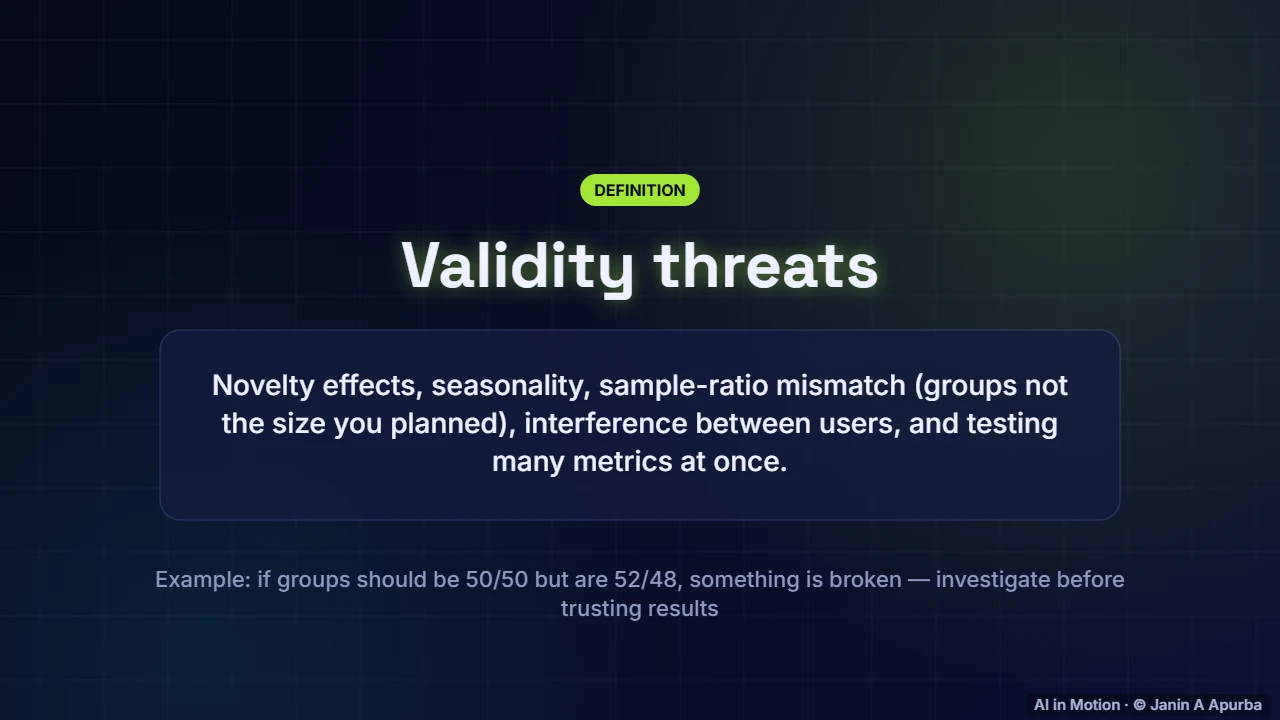
Many things can invalidate a test. Users may react to novelty, which fades. Weekly and seasonal patterns bias short tests. A sample ratio mismatch, groups that are not the planned size, signals a bug in assignment or logging. Users can influence each other, and testing many metrics at once produces false positives.
4:5014. Multiple comparisons
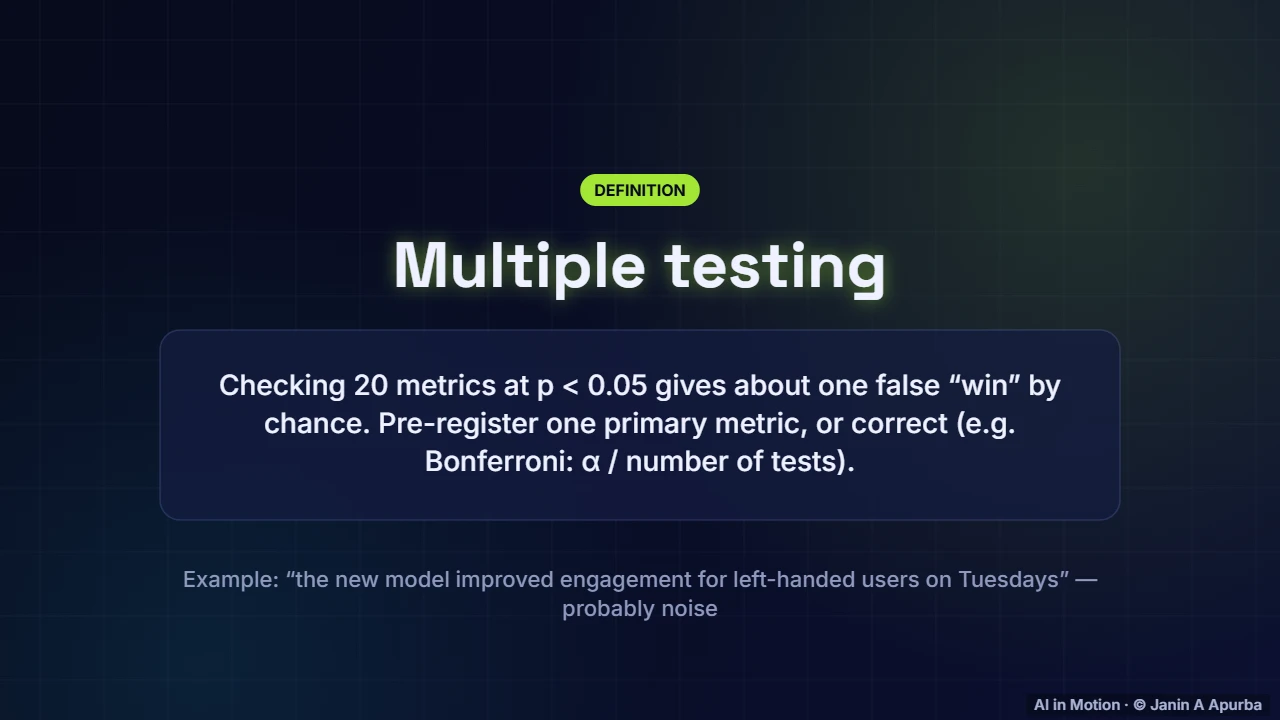
Beware multiple comparisons. If you check twenty metrics, or twenty segments, at the point zero five level, you expect about one false win by pure chance. Pre register a single primary metric, and correct for the others, for example with the Bonferroni method, which divides the threshold by the number of tests.
5:1215. Long-term effects
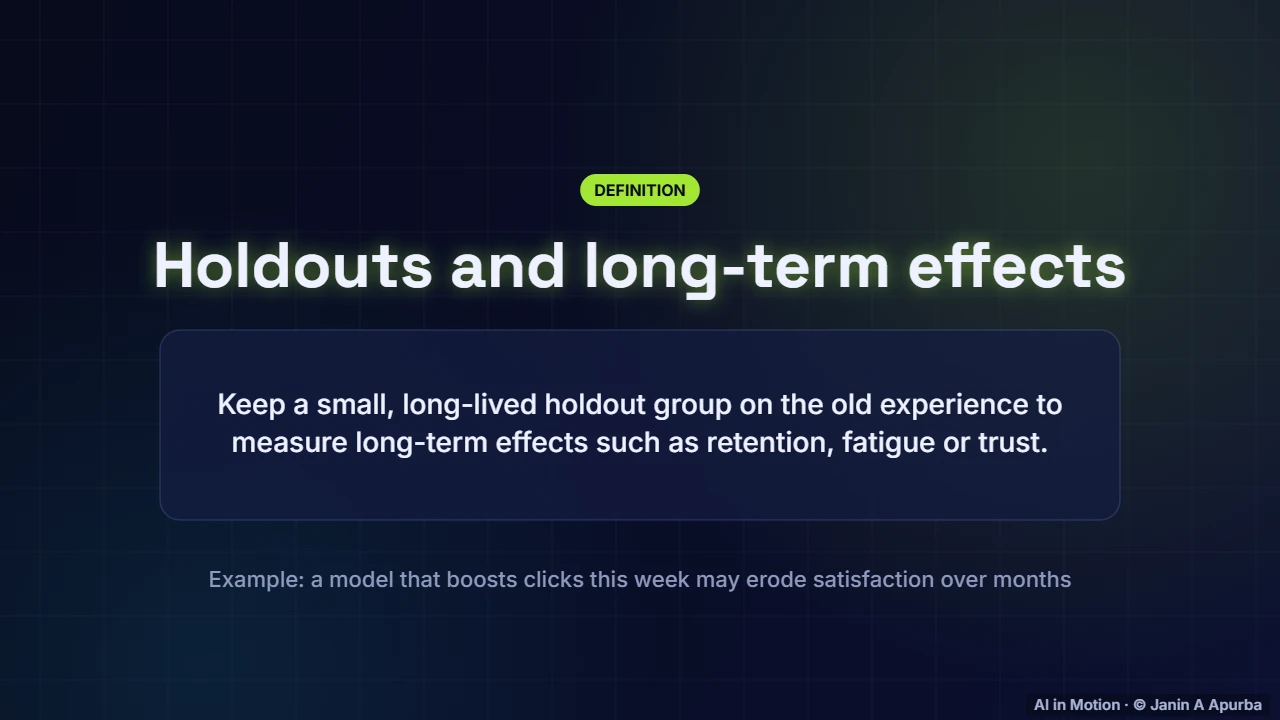
Some effects appear only slowly. A model that boosts clicks this week might erode satisfaction or trust over months. Keeping a small, long lived holdout group on the old experience lets you measure these long term effects, and reveals whether many small wins really add up.
5:3116. Faster alternatives
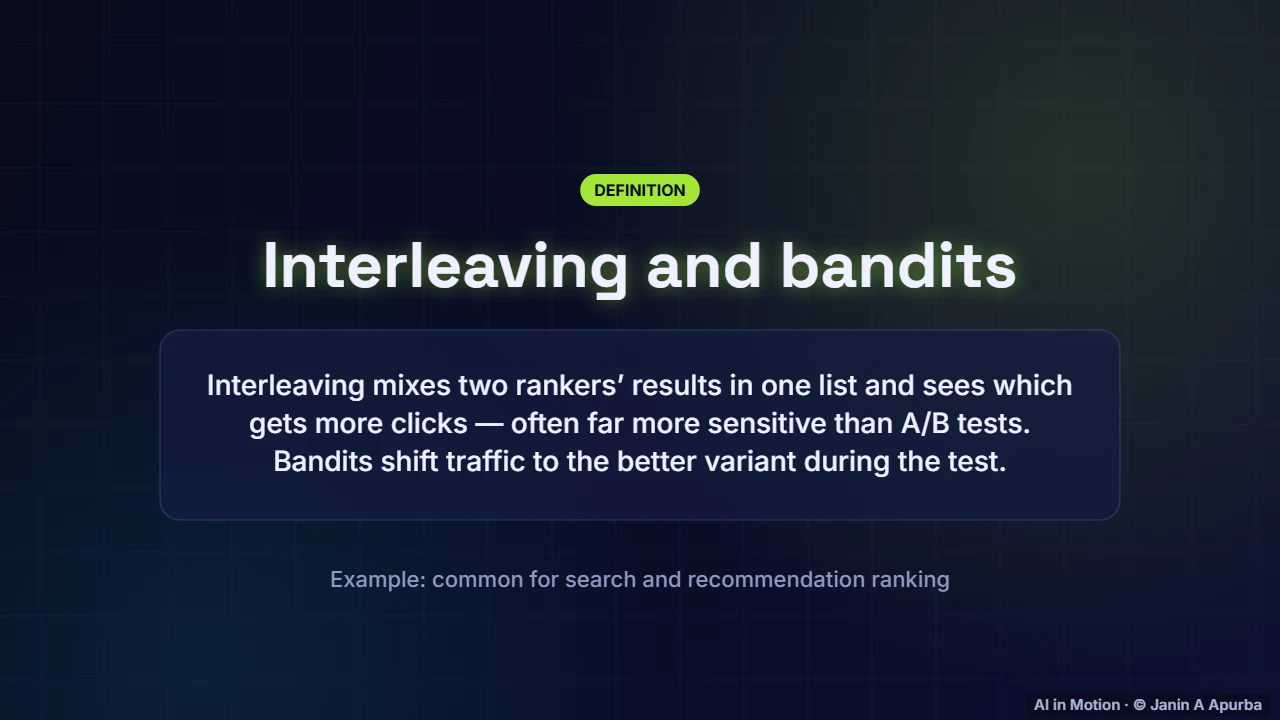
For ranking systems, interleaving is a powerful alternative: results from both rankers are mixed into one list, and whichever gets more clicks wins, which is often far more sensitive than a split test. Bandits, covered in the reinforcement learning track, shift traffic towards the better variant while the test is still running.
5:5317. Model cards
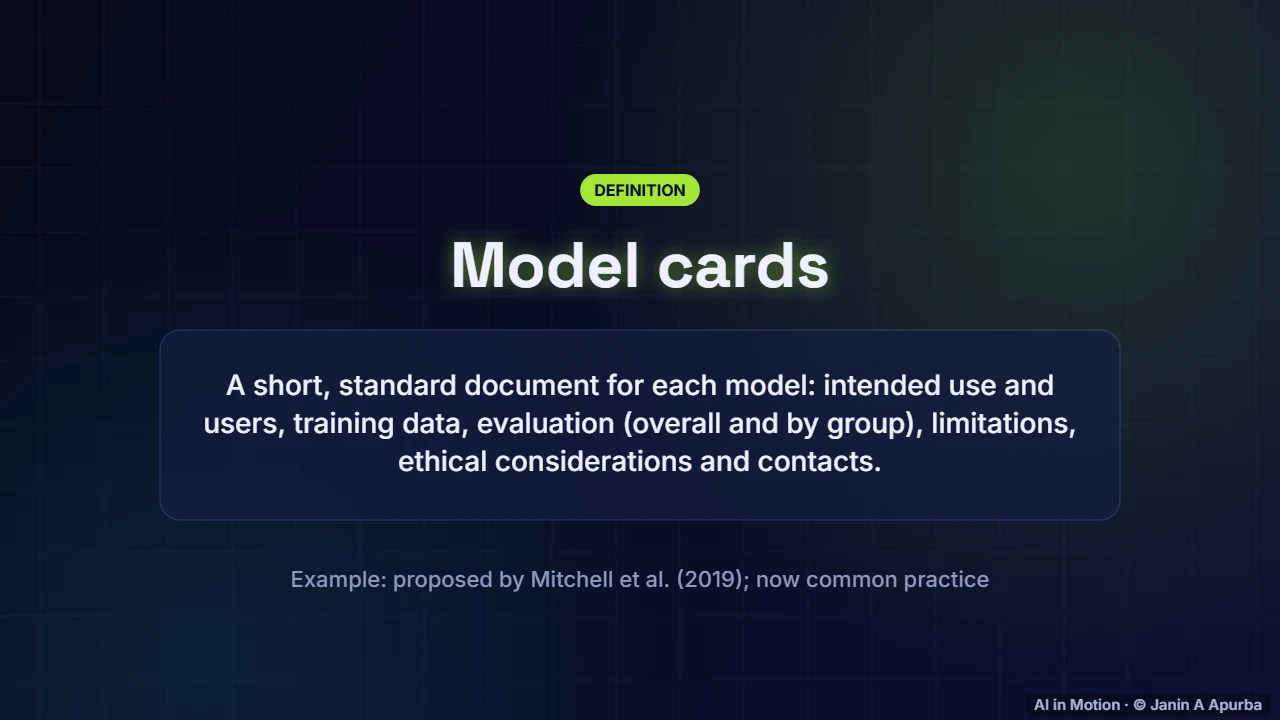
Now to responsible operation. A model card, proposed in 2019, is a short standard document for every model. It states the intended use and users, the training data, evaluation results overall and by group, known limitations, ethical considerations and who to contact. It helps everyone use the model appropriately.
6:1418. A model card
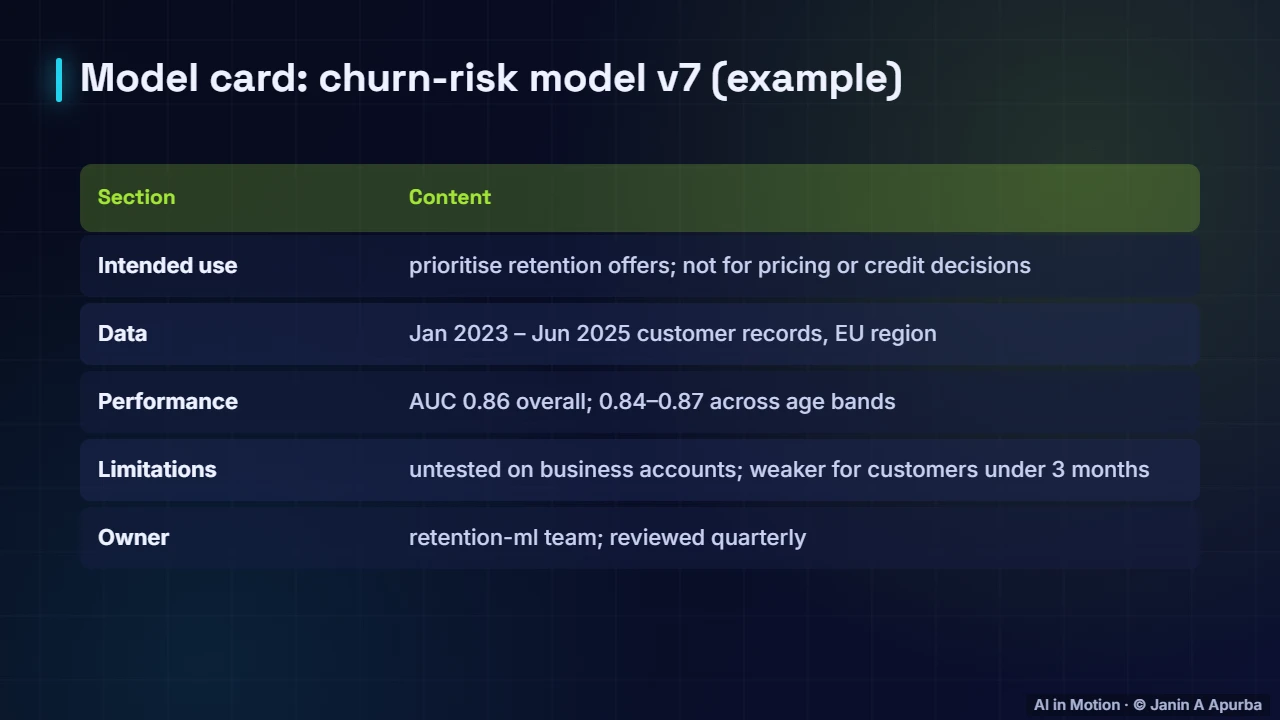
Here is an example. The card says the churn model is for prioritising retention offers, and must not be used for pricing or credit. It lists the data period and region, performance overall and across age bands, known weaknesses such as new customers, and the team that owns it and reviews it every quarter.
6:3719. Fairness
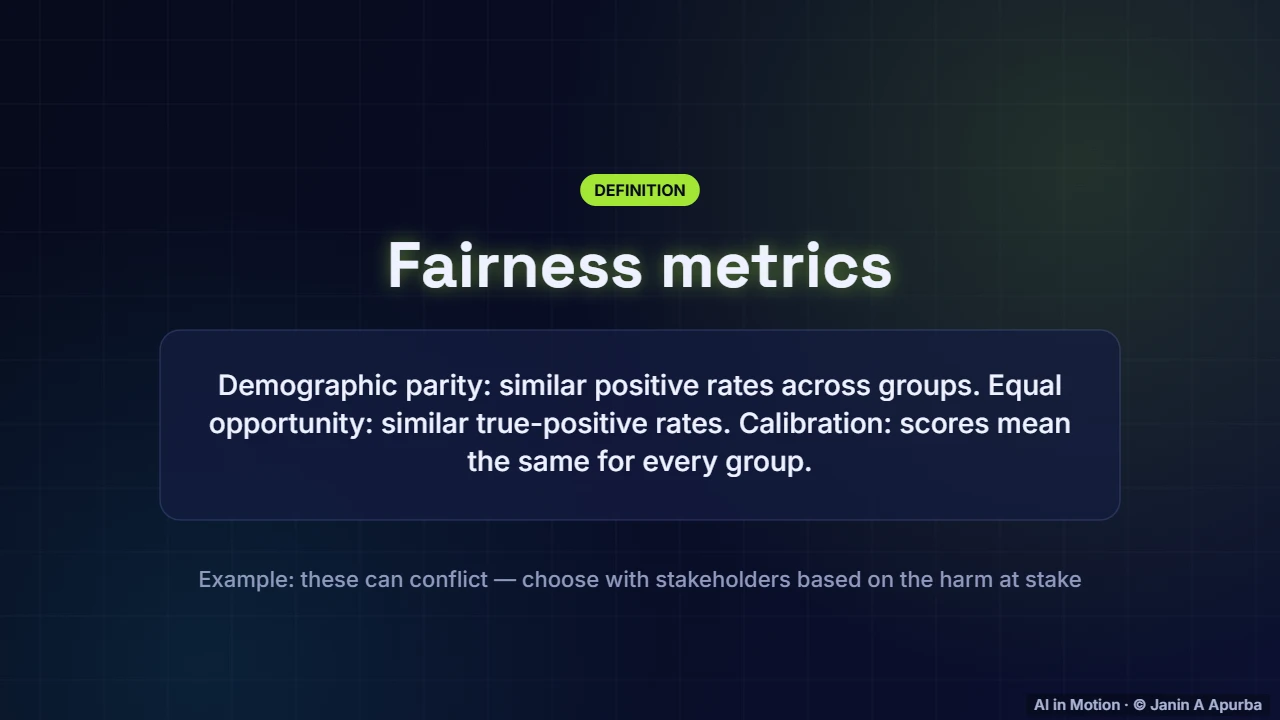
Fairness can be measured in several ways. Demographic parity asks for similar positive decision rates across groups. Equal opportunity asks for similar true positive rates. Calibration asks that a given score means the same risk for everyone. These can conflict mathematically, so choose with stakeholders, based on the harms at stake.
6:5920. Errors by group
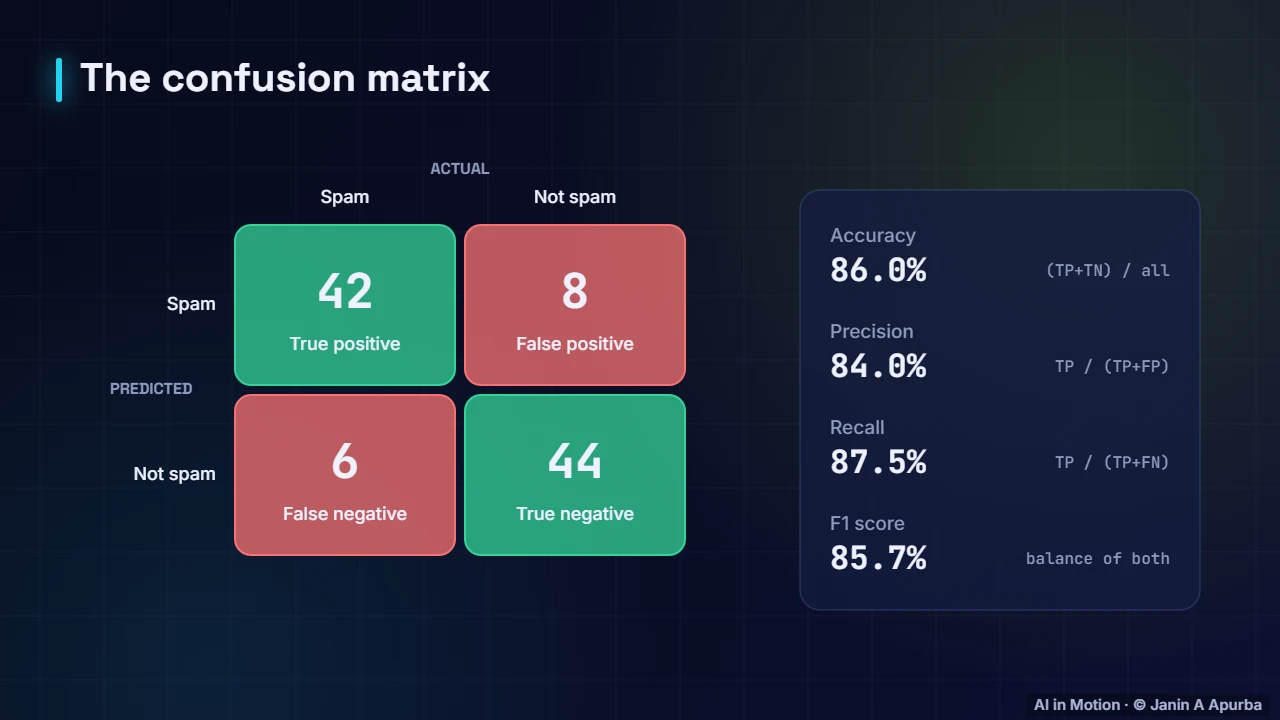
Fairness analysis starts from confusion matrices computed separately for each group. If one group suffers far more false negatives, for example qualified applicants being rejected, the model harms that group even if overall accuracy looks excellent. Compare error types, not just accuracy.
7:1721. Pause and think
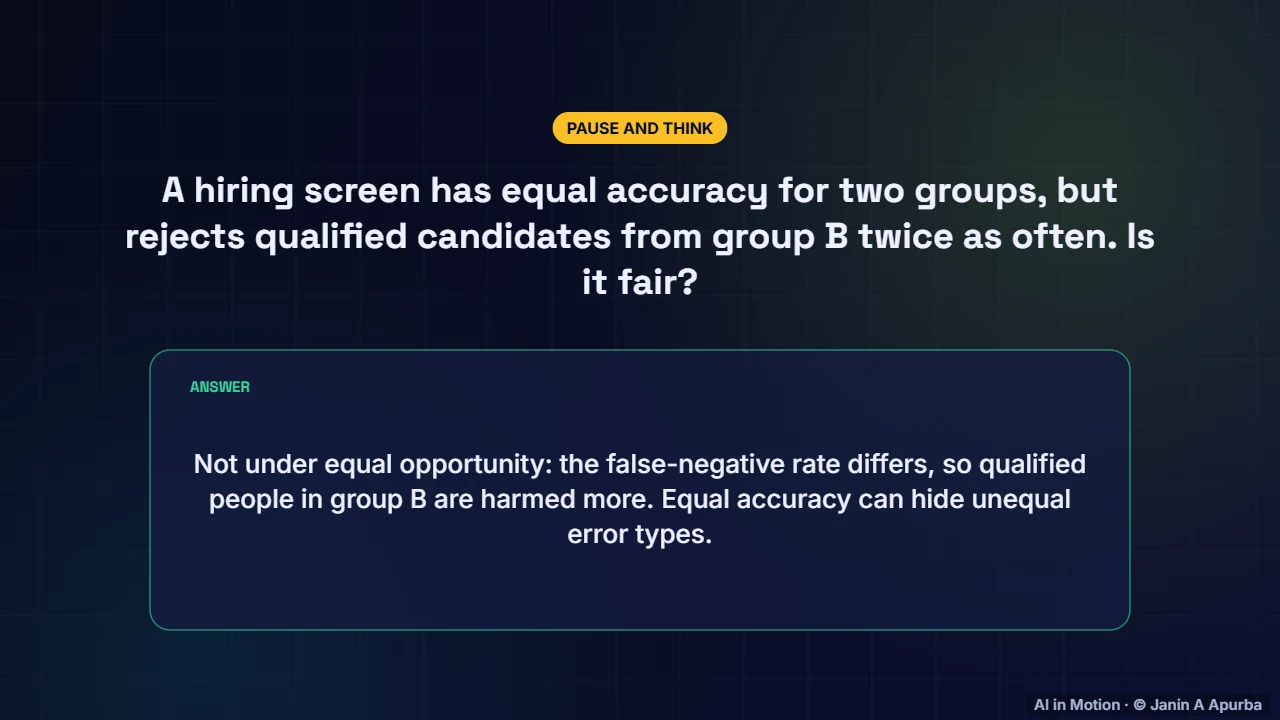
Pause and think. A hiring screen has equal accuracy for two groups, but rejects qualified candidates from group B twice as often. Is it fair? Not by the equal opportunity standard. The false negative rate differs, so qualified people in group B are harmed more. Equal accuracy can hide very unequal errors.
7:3922. Explainability
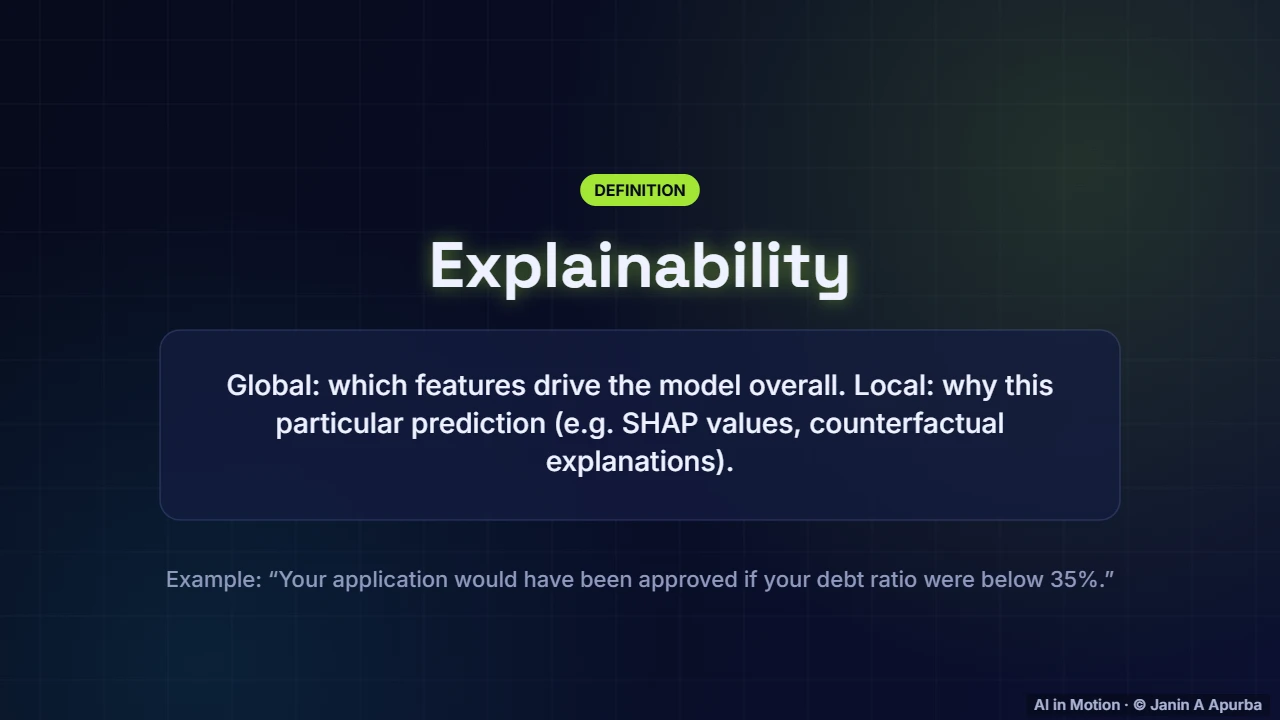
People affected by automated decisions often deserve an explanation. Global explanations show which features drive the model overall. Local explanations, such as SHAP values or counterfactuals, explain a single prediction, for example: your application would have been approved if your debt ratio were below thirty five percent.
7:5923. Privacy
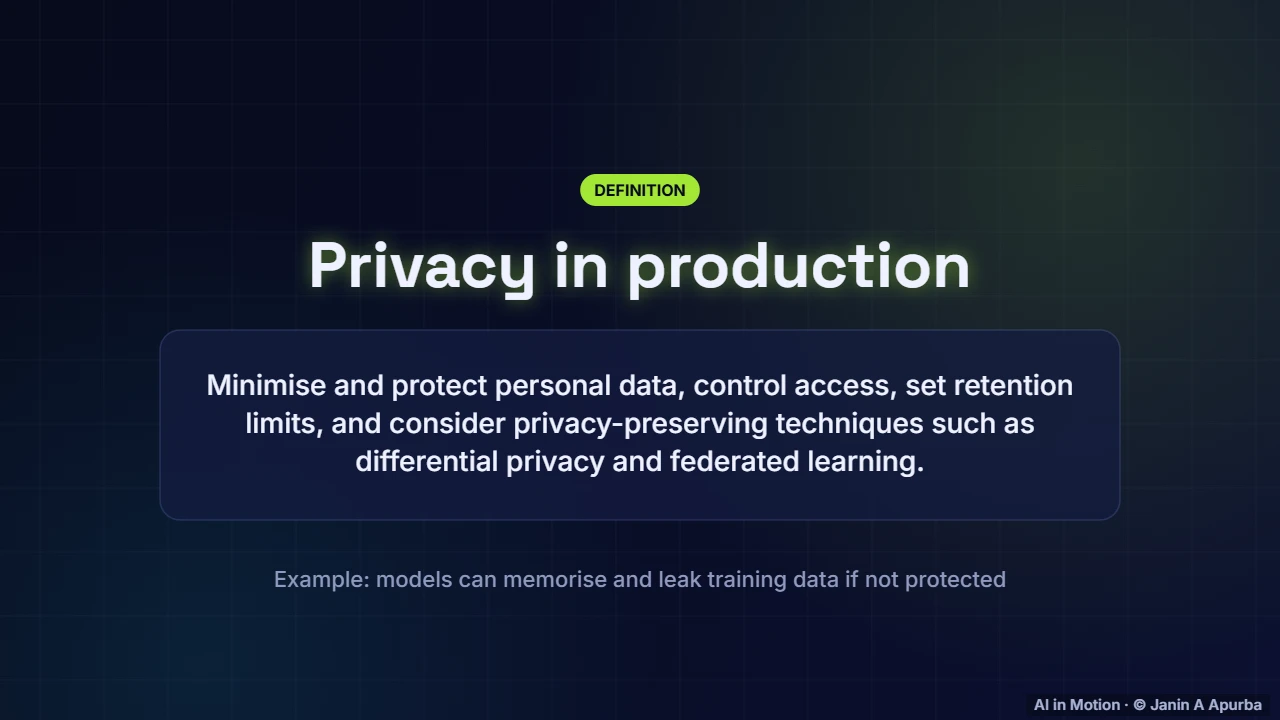
Privacy must be designed in. Collect the minimum personal data, protect and restrict access to it, and delete it on schedule. Models can memorise and leak training examples, so sensitive applications consider techniques such as differential privacy, which adds calibrated noise, or federated learning, which keeps data on devices.
8:1924. Governance and regulation
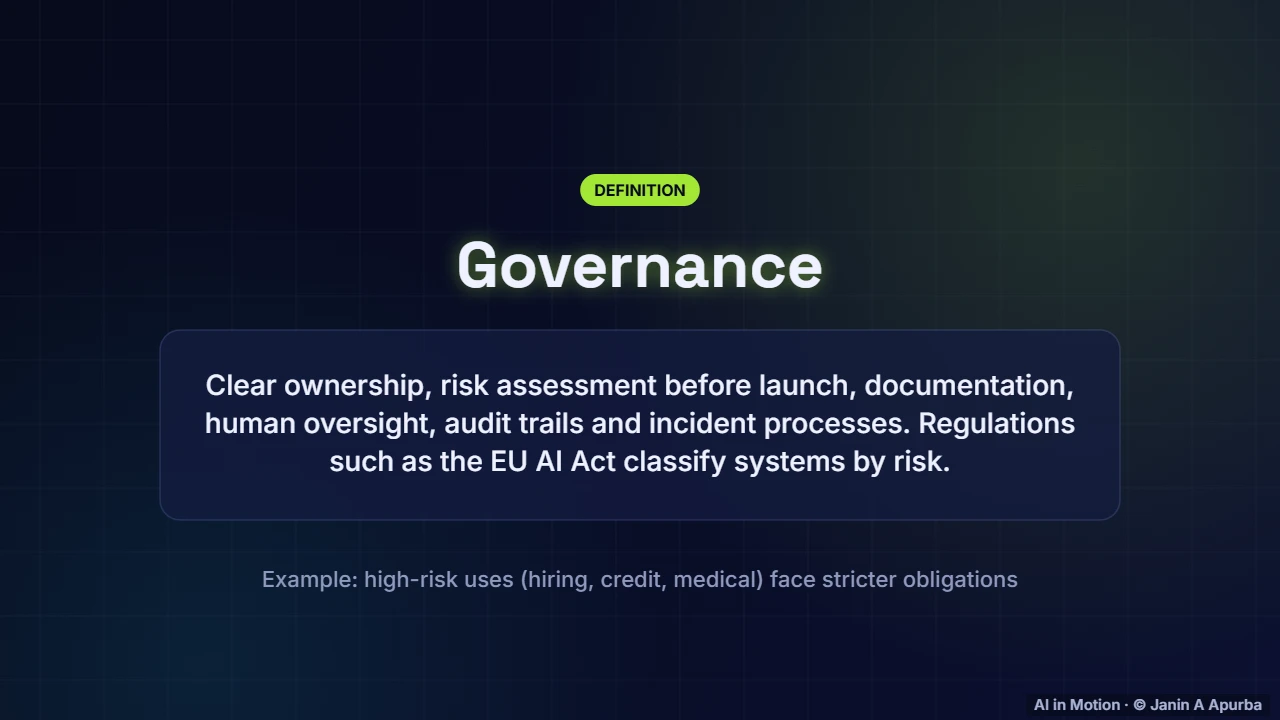
Governance ties it together: clear ownership, risk assessment before launch, documentation, human oversight, audit trails and incident processes. Regulation is catching up. The European Union’s AI Act, adopted in 2024, classifies systems by risk, with stricter obligations for high risk uses such as hiring, credit and medical devices.
8:4025. Human oversight
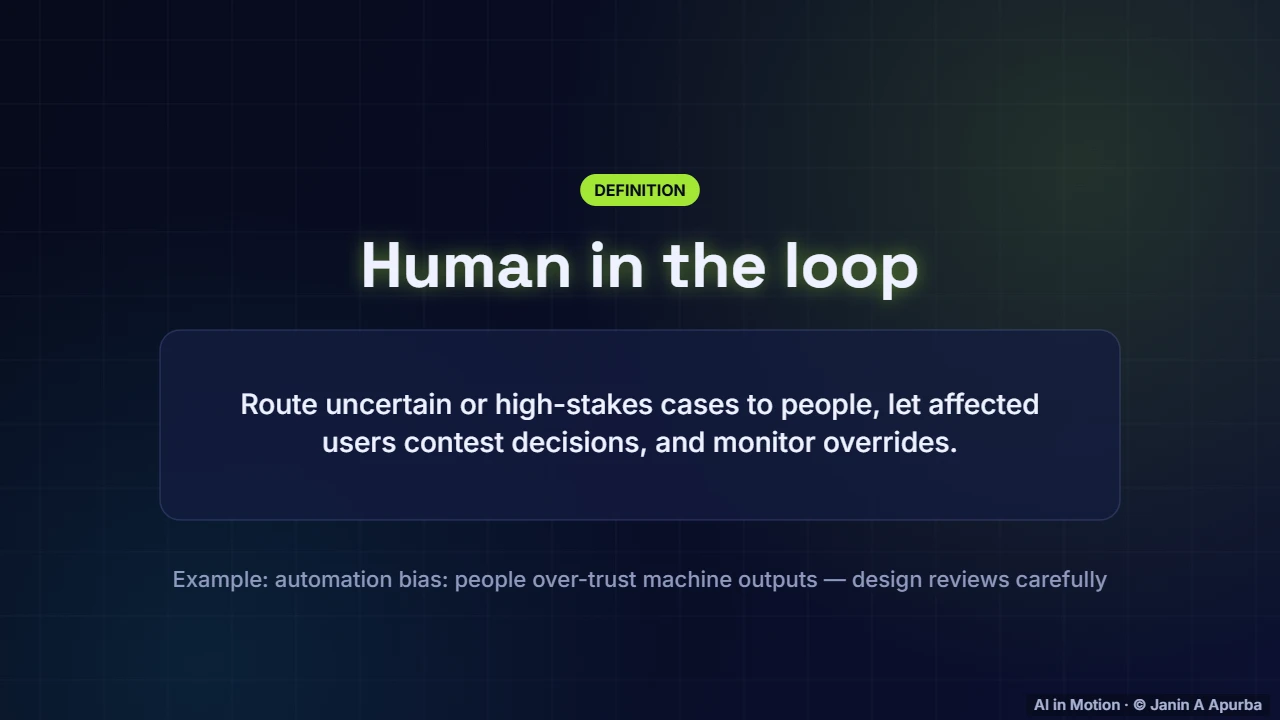
For high stakes decisions, keep people in the loop. Route uncertain or unusual cases to human reviewers, give affected users a way to contest decisions, and track how often reviewers override the model. Beware automation bias, the tendency to over trust machine output, which can make oversight a rubber stamp.
9:0126. Accountability
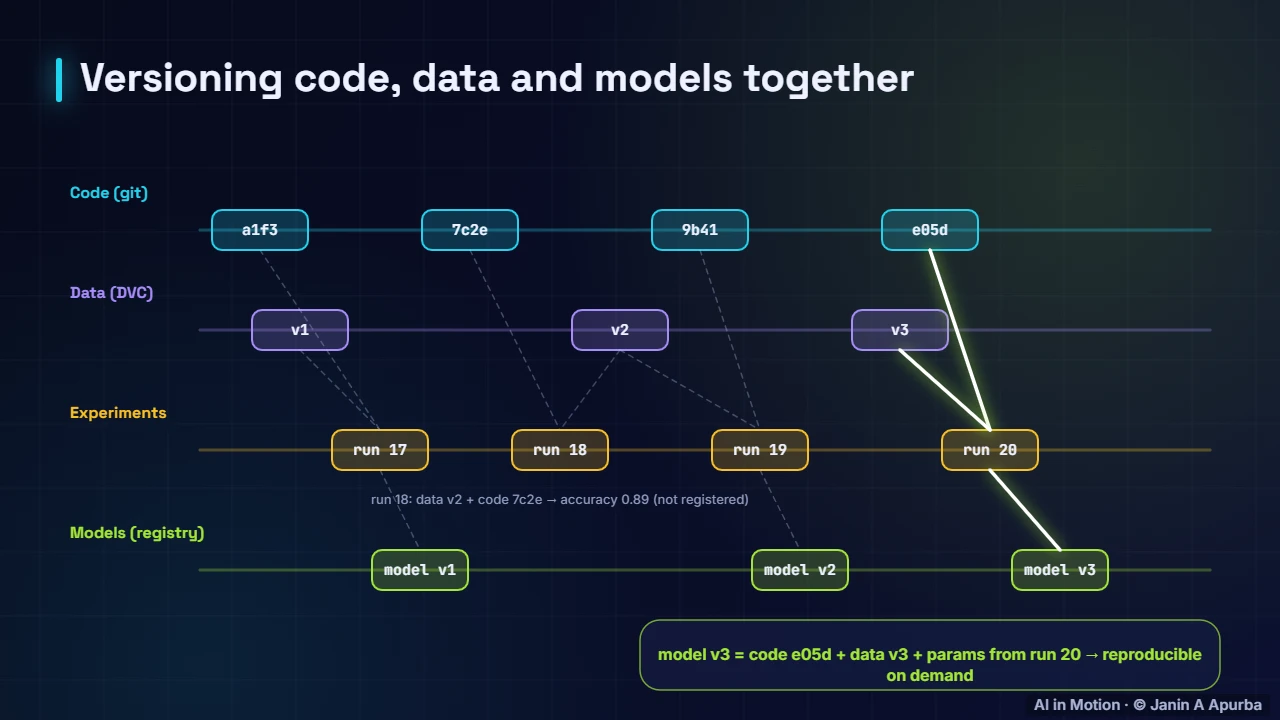
Accountability requires traceability. For any decision, you should be able to say which model version made it, which code and data produced that model, and who approved its release. The lineage we built for reproducibility doubles as the audit trail that regulators and affected people may ask for.
9:2227. Environmental cost
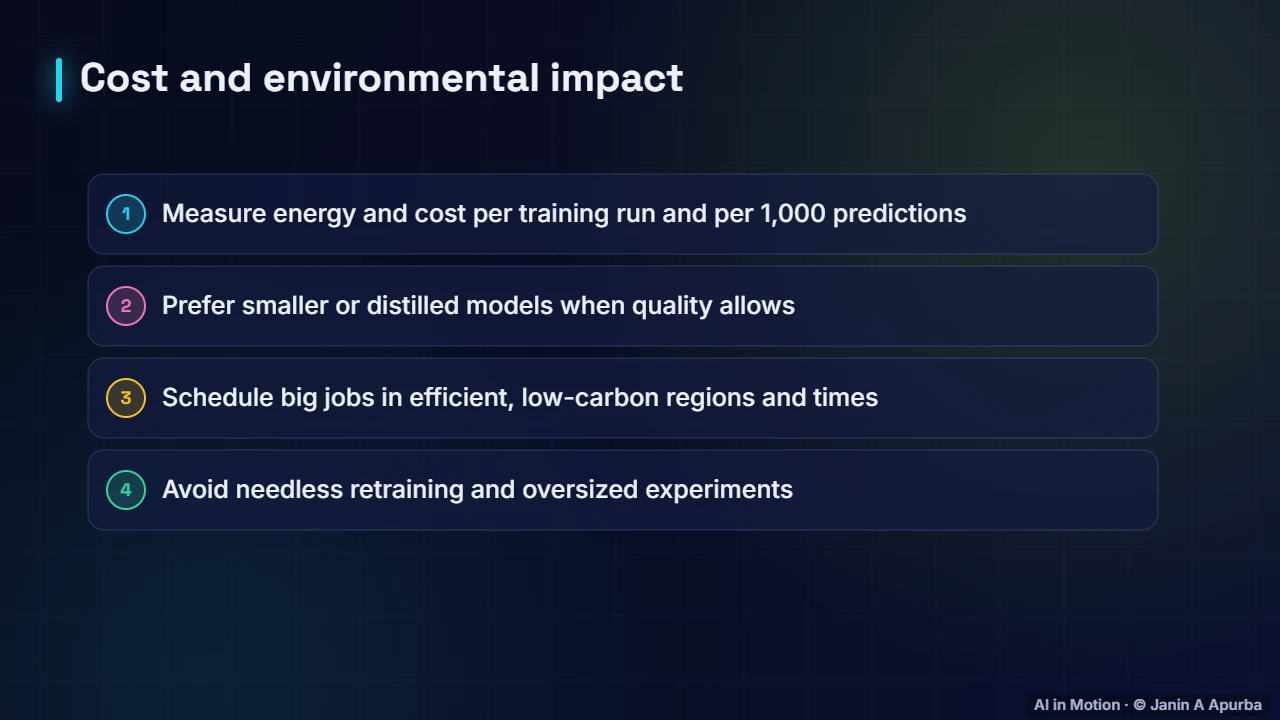
Responsibility also includes cost and environmental impact. Measure energy and cost per training run and per thousand predictions. Prefer smaller or distilled models when quality allows. Schedule large jobs in efficient, low carbon regions and times, and avoid needless retraining and oversized experiments.
9:4028. A responsible release
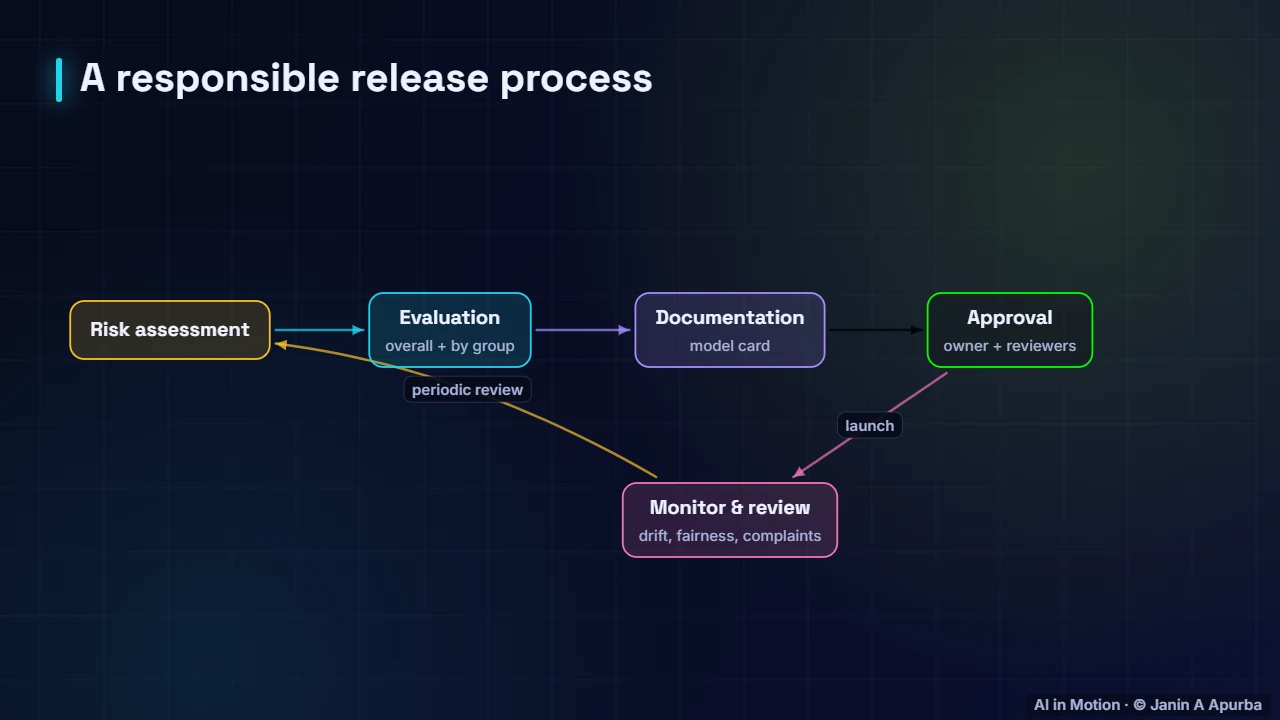
A responsible release follows a loop. Assess risks and who could be affected. Evaluate overall and by group. Document the model in a model card. Get explicit approval from the owner and reviewers. After launch, monitor drift, fairness and complaints, and review periodically, reassessing the risks as the world changes.
10:0129. Checklist
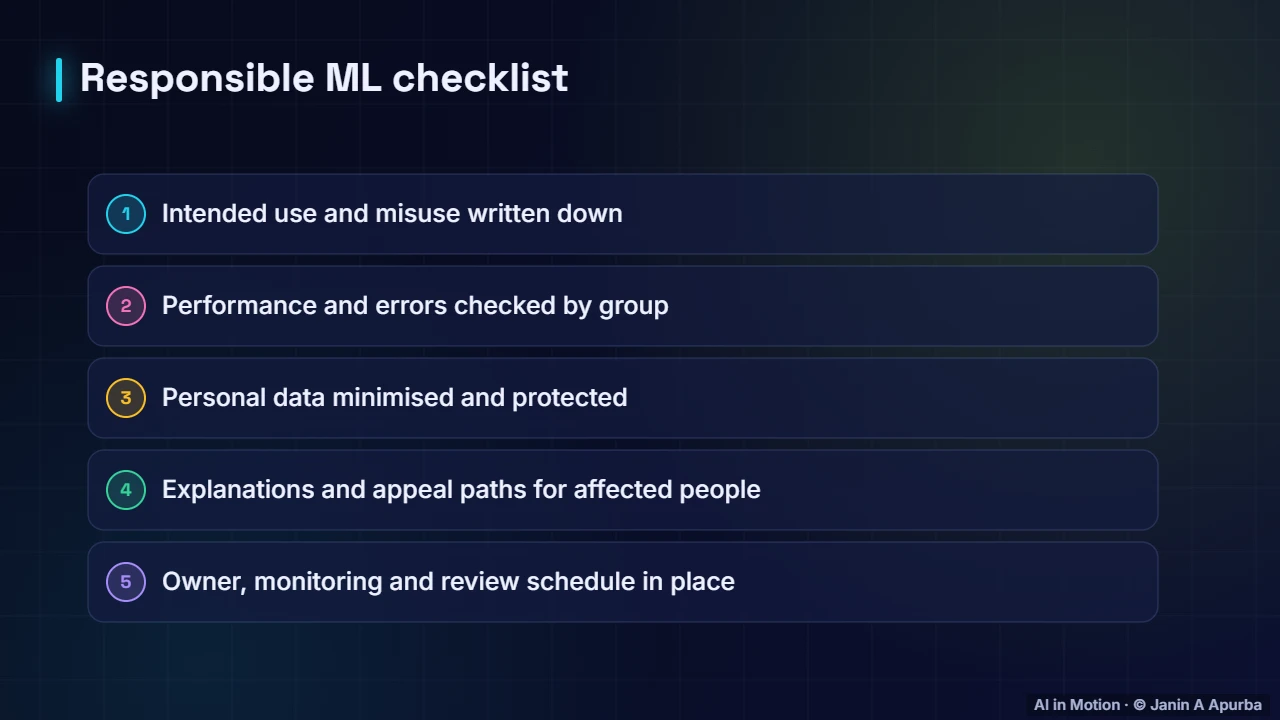
Here is a short checklist. Is the intended use, and misuse, written down? Are performance and errors checked by group? Is personal data minimised and protected? Can affected people get an explanation and appeal? And is there a named owner, with monitoring and a review schedule? If any answer is no, the model is not ready.
10:2530. Recap
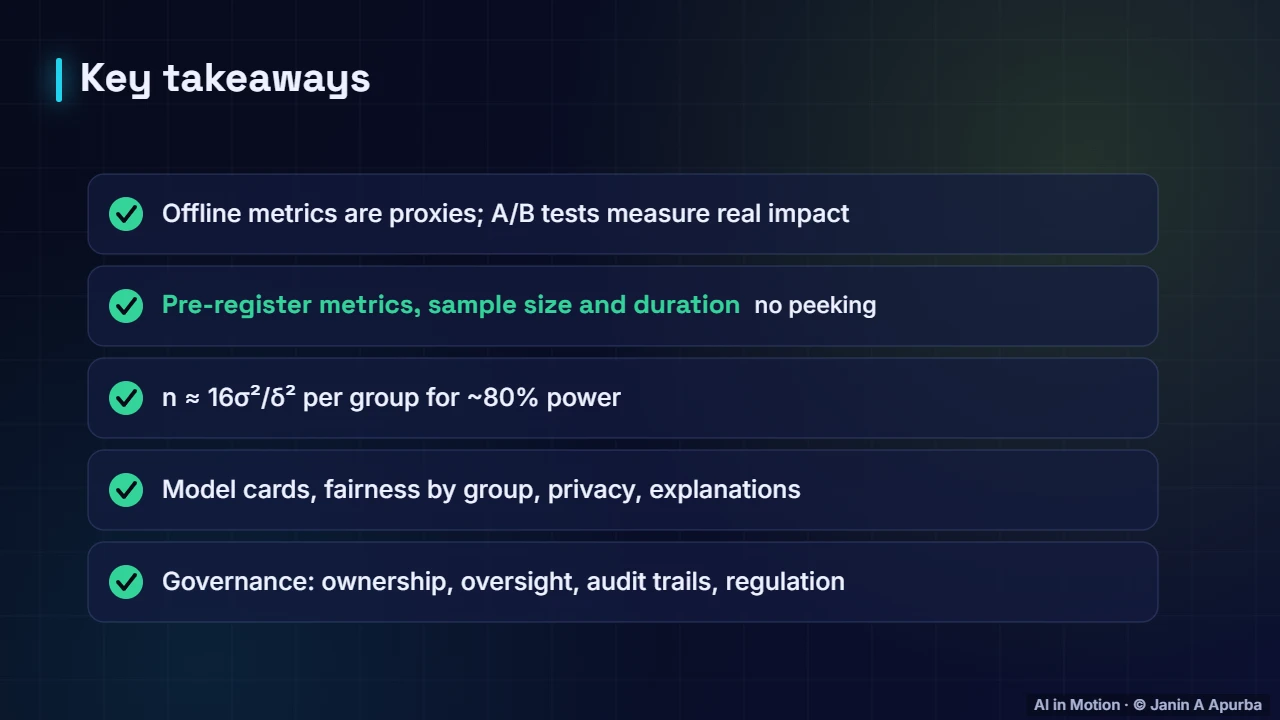
To recap. Offline metrics are proxies, and randomised A B tests measure real impact. Fix metrics, sample size and duration in advance, and do not peek. Use the sixteen sigma squared over delta squared rule for sample sizes. And operate responsibly with model cards, fairness checks, privacy, explanations and clear governance.
Key takeaways
- Offline metrics are proxies; randomised online experiments (A/B tests) measure real impact.
- Design tests up front: hypothesis, primary and guardrail metrics, sample size, duration, randomisation unit.
- A p-value is P(data this extreme | no difference); stopping at the first p < 0.05 (peeking) inflates false positives.
- Rule of thumb for ~80% power: n ≈ 16σ²/δ² per group (≈ 14,400 per group for 10% → 11%).
- Model cards document intended use, data, performance by group and limitations.
- Responsible ML covers fairness metrics, explainability, privacy, human oversight, governance (e.g. the EU AI Act) and environmental cost.
Check yourself
- Why is randomisation essential in an A/B test?
Show answer
It makes groups comparable, so differences are caused by the model — Random assignment balances everything else.
- What is “peeking”?
Show answer
Checking results repeatedly and stopping at the first significant result — It inflates false positives.
- With baseline 10% and a 1-point lift to detect, the rule of thumb gives about…
Show answer
14,400 — 16 × 0.09 / 0.0001 = 14,400.
- Equal opportunity requires similar…
Show answer
True-positive rates across groups — Qualified people should be recognised equally often.
- What is a model card?
Show answer
A short document describing a model’s intended use, data, performance and limitations — Proposed by Mitchell et al., 2019.
Go deeper
- A/B Testing and Online Evaluation of ML Models · The AI Lecture Hall
- Model Cards, Datasheets and Responsible Documentation · The AI Lecture Hall
- Fairness Metrics: Demographic Parity, Equalised Odds and Calibration · The AI Lecture Hall
- Explainable AI: LIME, SHAP and Interpretable Models · The AI Lecture Hall
- AI Regulation and Governance: The EU AI Act and Beyond · The AI Lecture Hall
© 2026 Janin A Apurba, CSE, AUST · Advanced ICT Officer, CNRS-UNHCR. All rights reserved. Notes for the animated lecture at https://ai-in-motion.vercel.app/watch/ab-testing-and-responsible-ml-in-production.html